Article by IG Chief Market Analyst Chris Beauchamp
Dow Jones, Nasdaq 100, Nikkei 225 Analysis and Charts
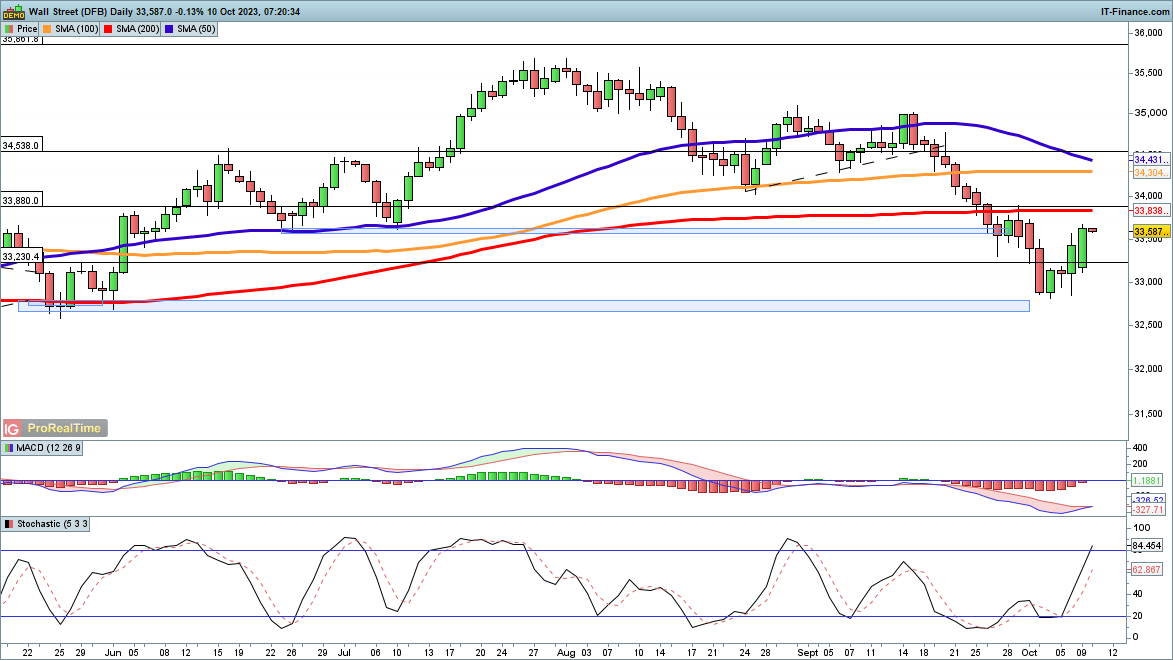
Dow at one-week high
The index surged on Monday, rallying back towards the 200-day simple moving average (SMA). This comes after the gains made on Friday following the payrolls report. For the moment a low appears to be in place. Gains at the end of September faltered at the 200-day SMA and the 33,900 level, so a close above here would bolster the bullish view. From there, the 50-day SMA and then the 35,000 highs from August and September are the next targets.
Trendline resistance from the July high may prevent the price from reaching the latter. A failure to close above the 200-day SMA and a move back below 33,500 might signal that a lower high is in place.
Dow Jones Daily Chart
Supercharge your trading prowess with an in-depth Equity analysis, offering insights from both fundamental and technical viewpoints. Download your free Q4 trading guide below

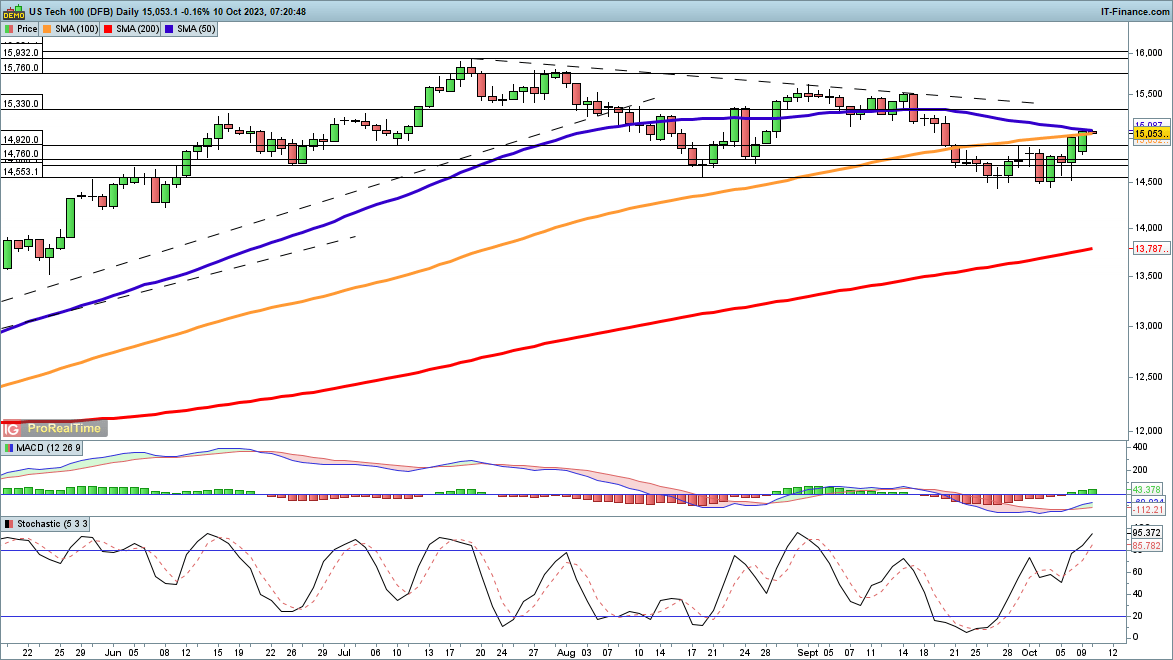
Nasdaq 100 returns to the 50-day moving average
Having spent last week defending the 14,500 level, the index has now pushed back toward the confluence of the 100- and 50-day SMAs.A close above the latter targets trendline resistance from the July highs, and then from there the 15,500 level of late August and early September comes into view. This breakout above trendline resistance would then see the price take on a further bullish aspect and then target the highs of July at 16,000.
Sellers will need a close back below 14,800 to suggest that another attempt to test support at 14,500 is in the offing.
Nasdaq 100 Daily Chart
Download our guide, "Traits of Successful Traders," and gain valuable insights to steer clear of common pitfalls that can lead to costly errors.

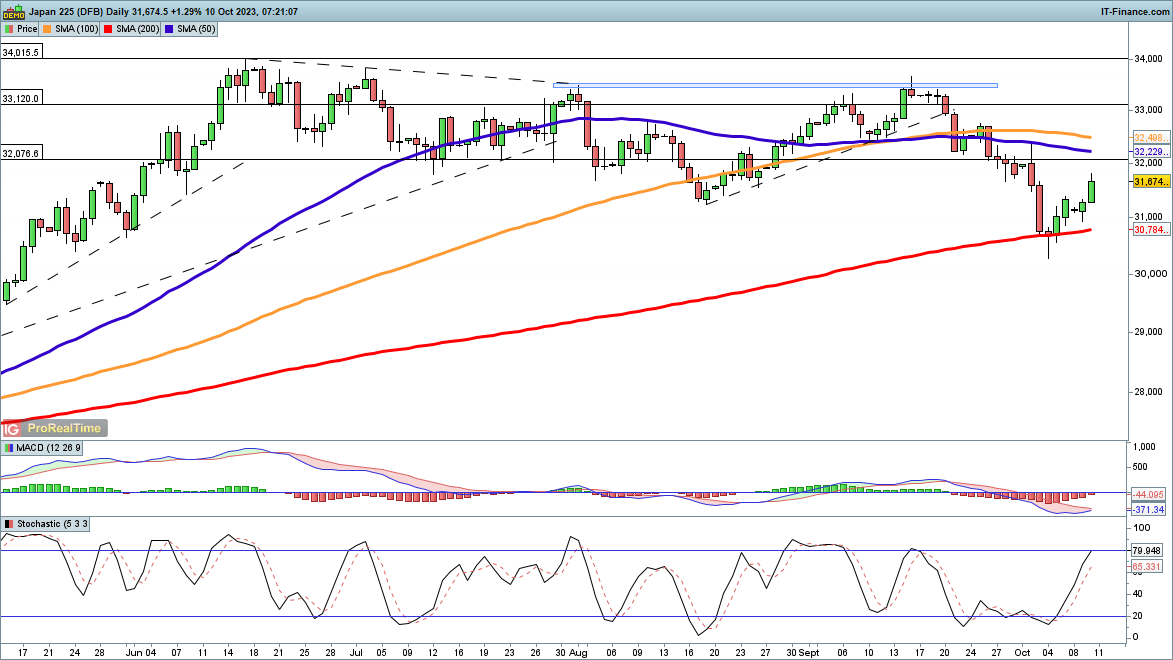
Nikkei 225 continues its rebound
Last week witnessed the index rally from the 200-day SMA, and it has held its ground in trading so far this week.All eyes are now on the 31,300 zone, to see if this low from August can be breached once more, which might then allow further bullish momentum to take the price on to the 50-day SMA, and then towards 33,000.
Sellers will need a reversal towards, and then a close below the 200-day SMA to provide a more bearish view. A close below last week’s low of 30,270 would reinforce this view.
Nikkei 225 Daily Chart