Article by IG Chief Market Analyst Chris Beauchamp
Dow Jones, Nasdaq 100, CAC 40 Analysis, Prices, and ChartsDow heading back towards 34,000
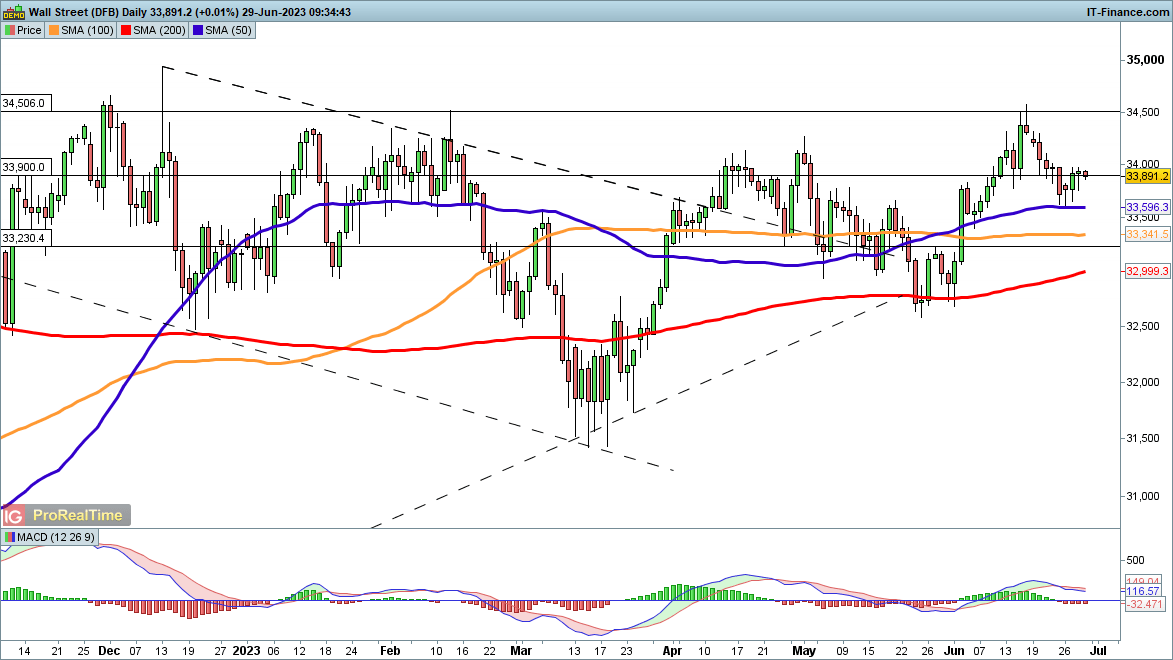
Dow heading back towards 34,000
After making headway yesterday the index has stalled in the short-term. A further push above 34,000 would help to revive the bullish view and open the way to 34,500.The recovery above the 50-day SMA this week has helped to create a higher low after the bounce from the late May low. It would require a reversal back below the 50-day SMA to negate the current bullish view.
Dow Jones Daily Price Chart

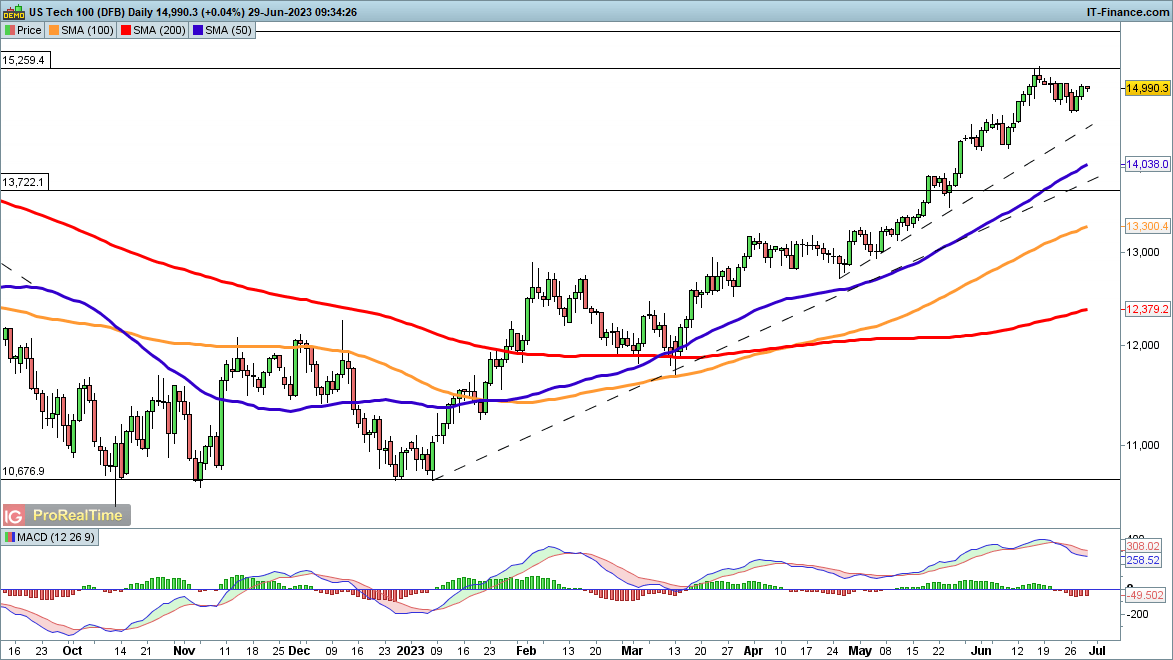
Nasdaq 100 edges towards 15,000
After a modest pullback, the price has recovered over the last two sessions. This puts it on track to challenge the 15,260 highs from June.
From here the next big level would be the 15,760 highs of September 2021, and then on to 16,630 the record highs for the index.
Nasdaq 100 Daily Price Chart
Trade Smarter - Sign up for the DailyFX Newsletter
Receive timely and compelling market commentary from the DailyFX team
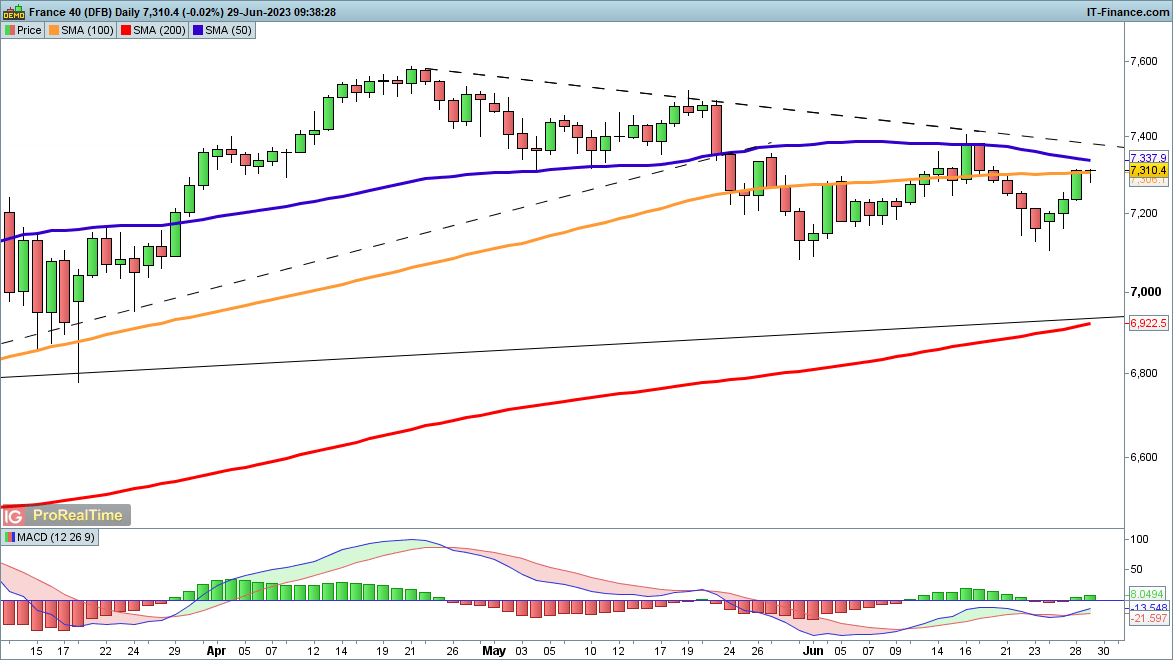
CAC 40 at one-week high
The rebound of the past three days looks set to continue, with the next target being the 50-day SMA, and then on to trendline resistance from the April highs.
A breakout above this and the mid-June highs would then open the way to 7500 and then the April high at 7600.It would need a drop back below 7100 to suggest that a medium-term bearish view is developing.
CAC 40 Daily Price Chart