


Q3 produced roughly $20 of price appreciation for both Brent crude and WTI but the upside may not end there. If fundamentals align to create demand while supply stays tight, $100 a barrel is not off the table.
Trade Smarter - Sign up for the DailyFX Newsletter
Receive timely and compelling market commentary from the DailyFX team
WTI Crude Oil Weekly Chart
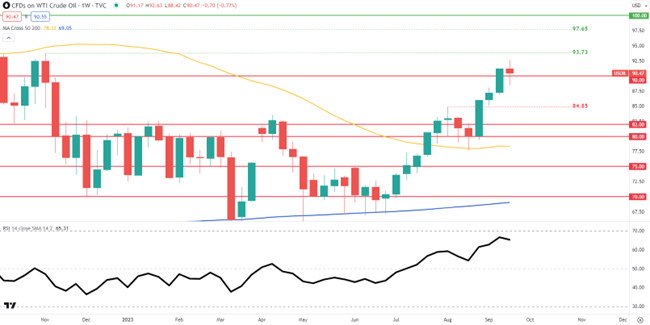
Source: TradingView, Prepared by Warren Venketas
The weekly WTI crude oil chart above is peaking its head above the $90.00 mark but has yet to build the confidence to firmly push higher just yet. The Relative Strength Index (RSI) is nearing overbought territory but this does not rule out additional upside before then. Oil may see some pullback as prices near these extreme level and revert to the mean (moving averages). That being said, it will be unwise to trade against the prevailing uptrend but possibly look for pullbacks to find opportunity (fundamental dependent).
Key resistance levels:
• $100.00
• $97.65
• $93.73
Key support levels:
• $90.00
• $84.85
• $82.00
• $80.00
Brent Crude Oil Weekly Chart
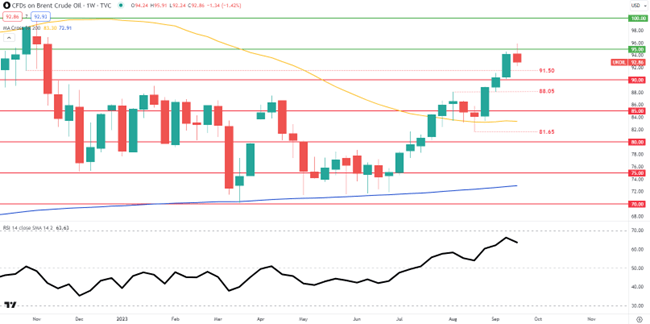
Source: TradingView, Prepared by Warren Venketas
Brent crude exhibits similar technical analysis to WTI being so closely related. The current weekly candle looks to be closing with a long upper wick which could kick-off Q4 on a negative note for crude oil. Overall, the oil backdrop looks positive and prices should remain relatively elevated throughout Q4.
Key resistance levels:
• $100.00
• $95.00
Key support levels:
• $91.50
• $90.00
• $88.05
• $85.00
Foundational Trading Knowledge
Commodities Trading
Recommended by Warren Venketas
Technical Forecast: Cautious
With so many fundamental factors at play, incoming data (China and US) and updates from major oil producing organizations and countries will need to be closely monitored to gauge some short-term directional bias on crude oil prices. Overall I would exercise caution particularly as we enter Q4 with prices trading at such extreme levels.


