


Crude Oil, Brent, WTI, US Dollar, US CPI, Fed, EIA, API, Backwardation, OVX – Talking Points
- Crude oil continues to recover, this time on the back of a weaker USD
- Inflation pressures eased again in June, leading to speculation that the Fed might change tack
- If there is a tilt in policy, will WTI surge higher again?

Crude oil jumped to a 10-week peak overnight as the US Dollar fell in a heap after a soft US inflation figure. The Brent futures contract traded as high as US$ 80.55 bbl while the WTI contract touched US$ 76.15 bbl.
The ‘big dollar’ finished the North American session lower against all currencies with the exception of a handful of emerging market pairs. The entire commodity complex also benefitted.
The month-on-month headline CPI gauge for June was 0.2% instead of 0.3% anticipated and against 0.1% previously to give a year-on-year number of 3.0%, slightly less than forecasts of 3.1% and 4.0% prior.
Looking at core CPI, it too was lower than estimates. The month-on-month read for June was 0.2%, below forecasts of 0.3% and 0.4% previously. Year-on-year it was 4.8%, softer than the 5.0% anticipated and 5.3% prior.
The easing of price pressures saw Treasury yields tumble across all tenors, particularly in the 2 to 10-year part of the curve.
The interest rate market interpreted the data as allowing the Fed to be less restrictive with monetary policy in 2024. Looking at the DXY index, the US Dollar is now back down to levels seen before the Fed started hiking rates in May 2022.

Perhaps inhibiting the rally for crude was the inventory data. Overnight saw the Energy Information Agency (EIA) reveal that US stockpiles had gained by 5.946 million barrels in the week ended July 7th. This was notably larger than the 0.483 million barrels increase that was anticipated.
The EIA figures were similar to the previous day’s American Petroleum Institute (API) inventory report which showed a bump up of 3.026 million barrels for the same week. The gain was a turnaround of 4.382 million fewer barrels in the week prior.
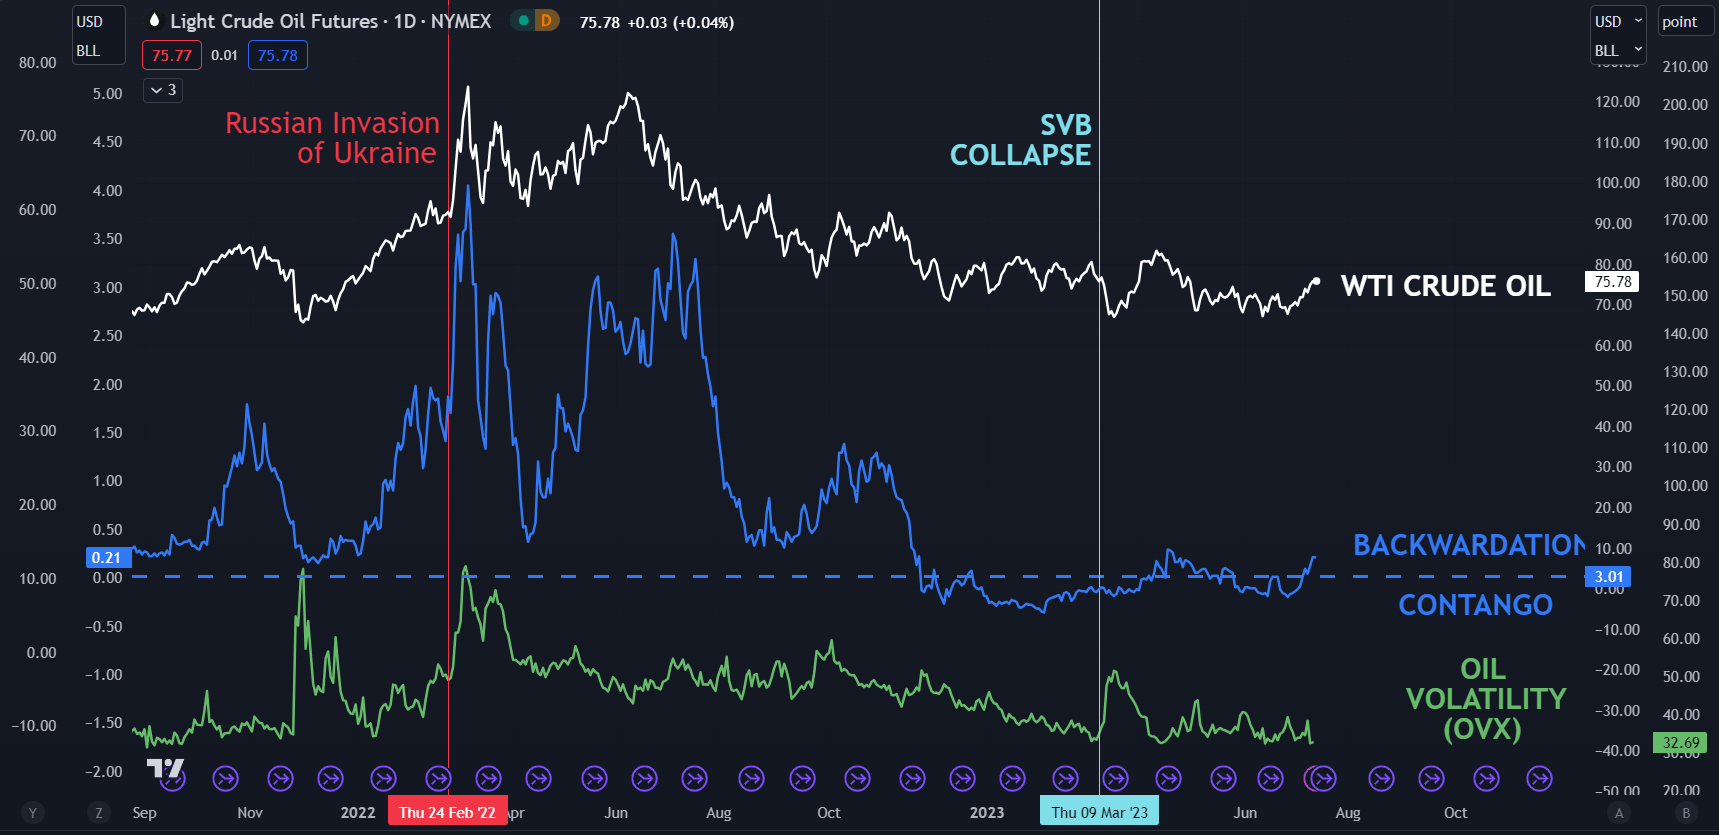
Perhaps supporting black gold is the difference in price between the front 2 WTI futures contract. It has moved toward backwardation, which is when the first contract is trading at a premium to the contract that is maturing after it. It potentially indicates that buyers are willing to pay more for immediate delivery.
At the same time, oil volatility as measured by the OVX index, remains subdued and may suggest that the oil market is unperturbed about the recent price action.
Looking forward, Beijing has been leaning toward measures to reignite China’s economy and if significant stimulatory policies are announced, it might be supportive of oil.
WTI CRUDE OIL, BACKWARDATION/CONTANGO, VOLATILITY (OVX)
--- Written by Daniel McCarthy, Strategist for DailyFX.com
Please contact Daniel via @DanMcCarthyFX on Twitter


