


This article is specifically dedicated to analyzing the technical outlook for the British pound. If you are interested in the currency’s fundamental prospects, request our brand-new Q1 forecast now!

The technical outlook for GBP/USD in the months ahead is uncertain due to the ever-moving backdrop of US and UK interest rate expectations. The likely outcome is that GBP/USD moves slowly higher with a raft of US rate cuts already priced into the US dollar, while Sterling has further to go to price in recent dovish rate expectations.
The daily GBP/USD chart remains positive after turning higher at the start of October. The pair continue to make higher lows and higher highs and while this pattern persists then cable will continue to push back toward the mid-July high at 1.3143. Before this GBP/USD will have to battle through a couple of layers of horizontal resistance at 1.2667 and 1.2742 and the 23.6% Fibonacci retracement level at 1.2823. While the outlook for GBP/USD is mildly positive, the mid-July may be a tough target to reach in Q1 2024.
GBP/USD Daily Price Chart
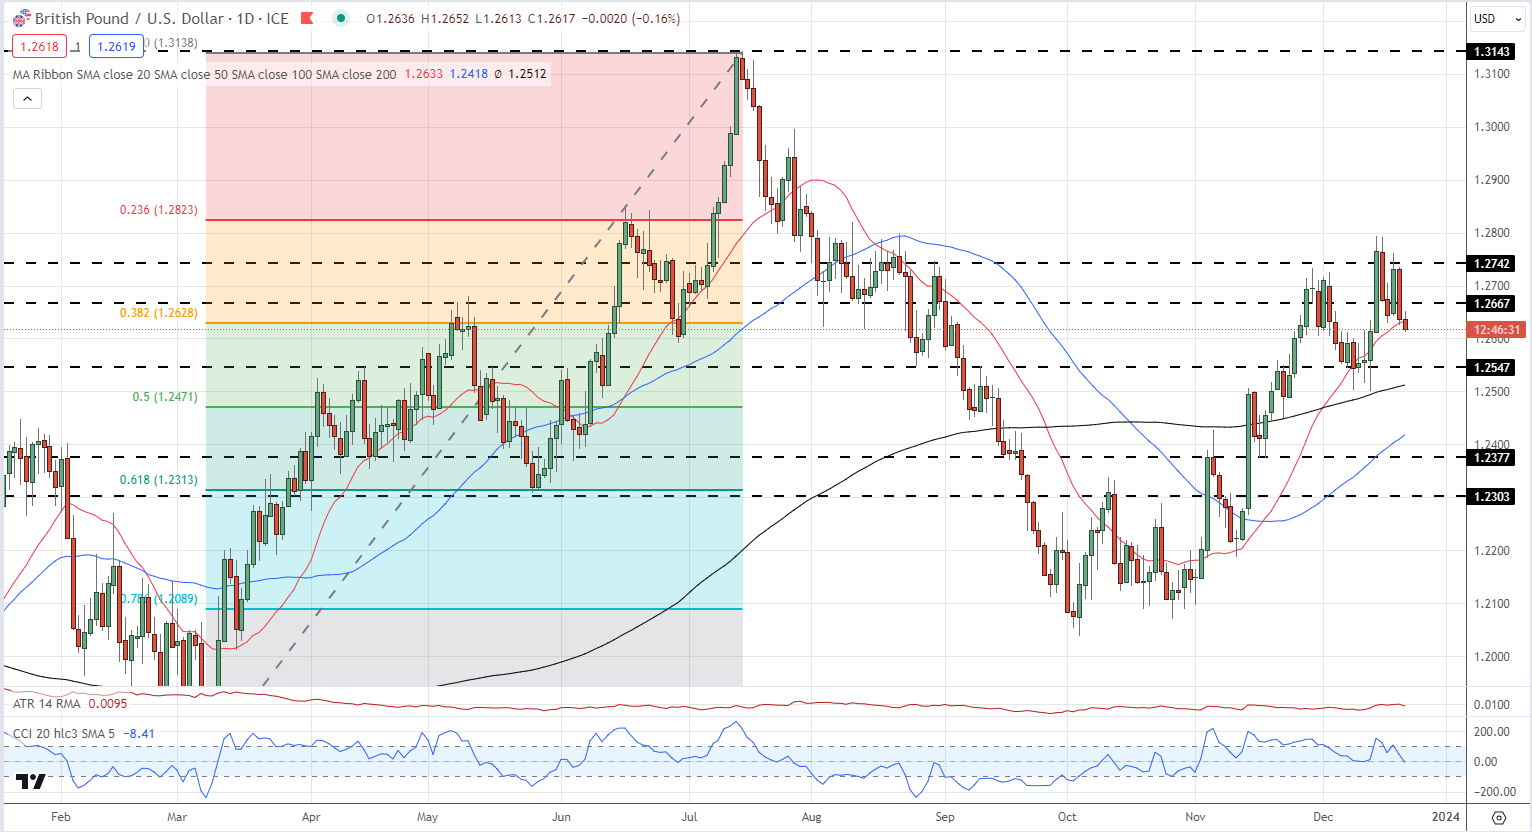
Source: TradingView
Curious to learn how retail positioning can shape the short-term trajectory of EUR/GBP? Our sentiment guide has all the relevant information you need. Grab a free copy now!
| Change in | Longs | Shorts | OI |
| Daily | -22% | 29% | -8% |
| Weekly | -14% | 21% | -3% |
EUR/GBP has been a range trader’s delight since mid-Q2 this year with the pair offering multiple opportunities to enter trades with limited downside. There were multiple touches on either side of 0.8500 that offered low-risk entry points, while the 0.8700 to 0.8750 area offered a reversal trade. The CCI indicator (bottom of the chart) also showed that overbought and oversold conditions highlighted potential trade set ups (sell overbought/buy oversold). Looking forward there seems little reason for this trading range to break. While this range won’t appeal to short-term traders, it does offer a fairly robust longer-term trade idea with recent history on its side. Near-term price action will be defined by the 50- and 200-day simple moving averages with a confirmed break above both opening up 0.8700.
EUR/GBP Daily Chart
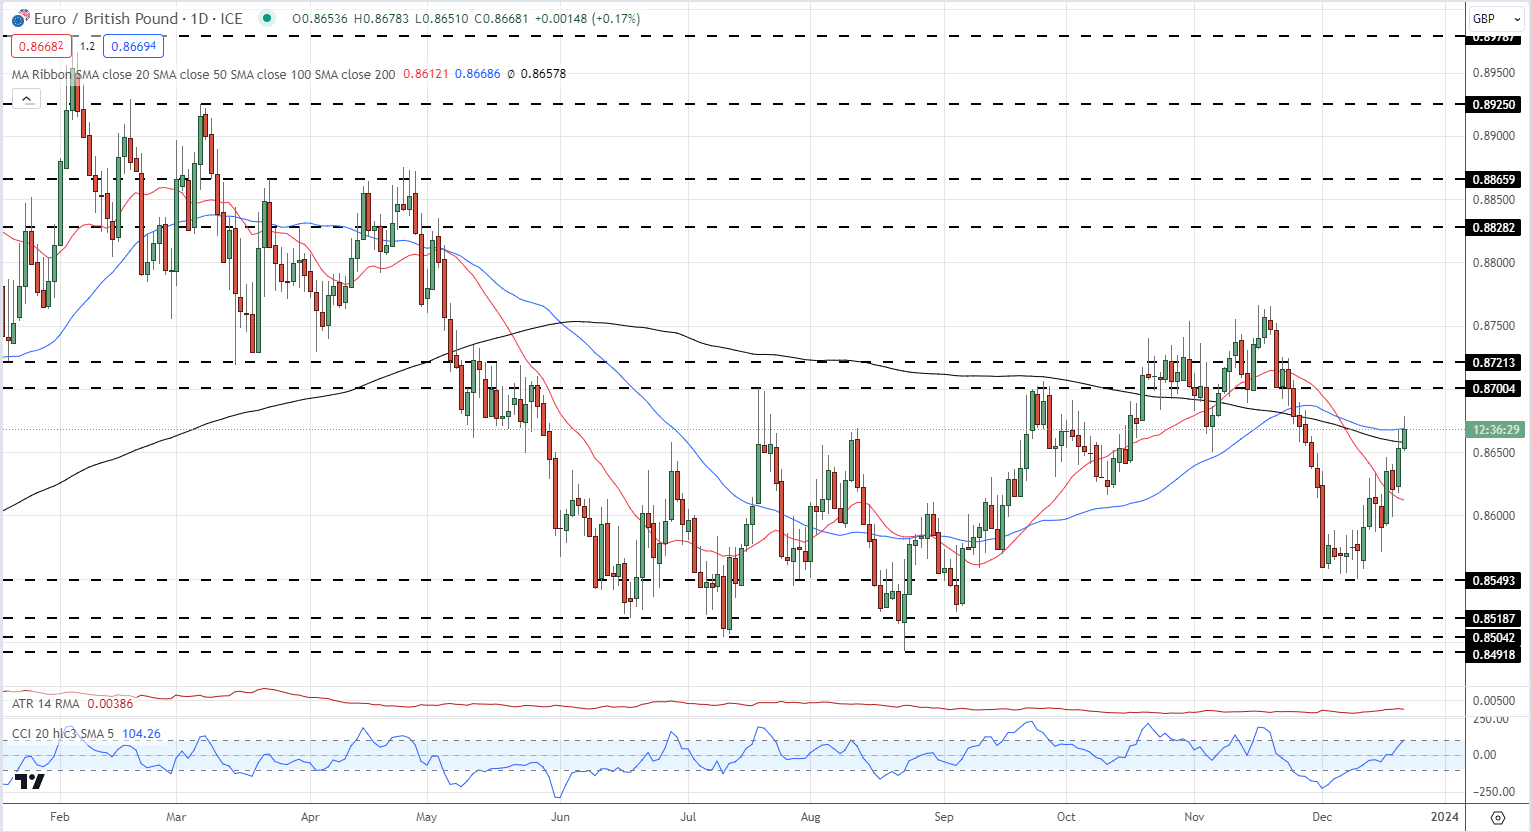
Source: TradingView


