
British Pound (GBP/USD) Analysis and Charts
- The Bank of England’s mildly hawkish hold.
- Global bond yields turn lower as market thoughts turn to rate cuts.
- Cable pops through resistance, and prints a six-week high.
After weeks of being under pressure from a strong US dollar, GBP/USD has turned sharply higher over the last two sessions. Thursday’s Bank of England meeting saw the MPC leave rates unchanged, as expected, but Governor Andrew Bailey's mildly hawkish post-decision commentary pushed back expectations of a UK rate cut further into next year, underpinning the British Pound.
Bank of England Leaves Rates Unchanged, GBP/USD Grabs a Small Bid

Earlier today, the latest US Jobs Report saw 150k created in October, missing market expectations of 180k. The prior month's number was also revised lower to 297k from a previously reported 336k, while August’s number was revised lower from 227k to 165k. In addition, the unemployment rate moved marginally higher to 3.9% from a prior reading, and expectations, of 3.8%.
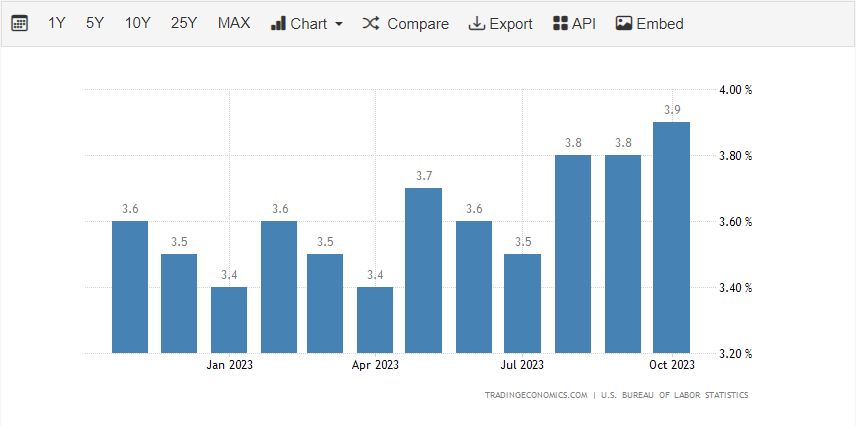
US Breaking News: NFP Disappointment Sinks USD, Gold Bid
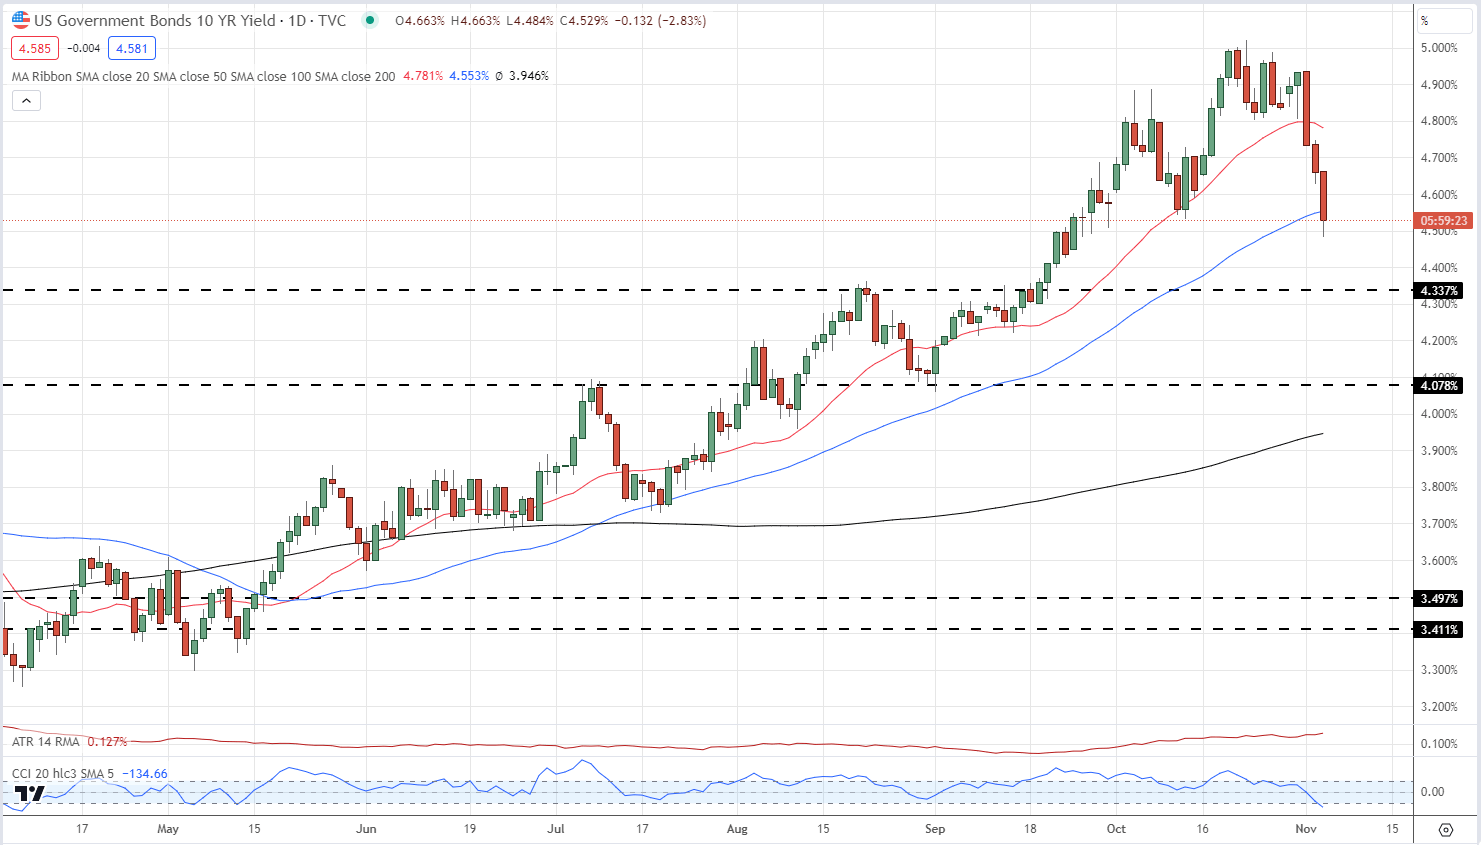
US Treasury yields have been moving lower this week and the sell-off accelerated today after the NFP report. There is a growing feeling that rates in the US have peaked and that with a potential recession in the coming months, rate cuts will be needed sooner rather than later next year. The benchmark US 10-year made a fresh 16-year high of 5.02% in late October – it currently trades at 4.53%.
US Treasury 10-Year Yield
For all market-moving economic data and events, see the DailyFX Calendar

GBP/USD is benefitting from this US dollar weakness and has pushed back to levels last seen six weeks ago. From a technical perspective, the break and open above the 20-day simple moving average confirms short-term strength, while a close and open above the 50-dsma would further confirm a move higher. The CCI indicator is flashing a multi-month overbought signal, so the next move higher may be tempered over the coming days. The 200-dsma is currently at 1.2434, ahead of horizontal resistance at 1.2440 and the 50% Fibonacci retracement level at 1.2470. To move above here, GBP/USD will need some domestic drivers to take over from the US dollar.
GBP/USD Daily Price Chart
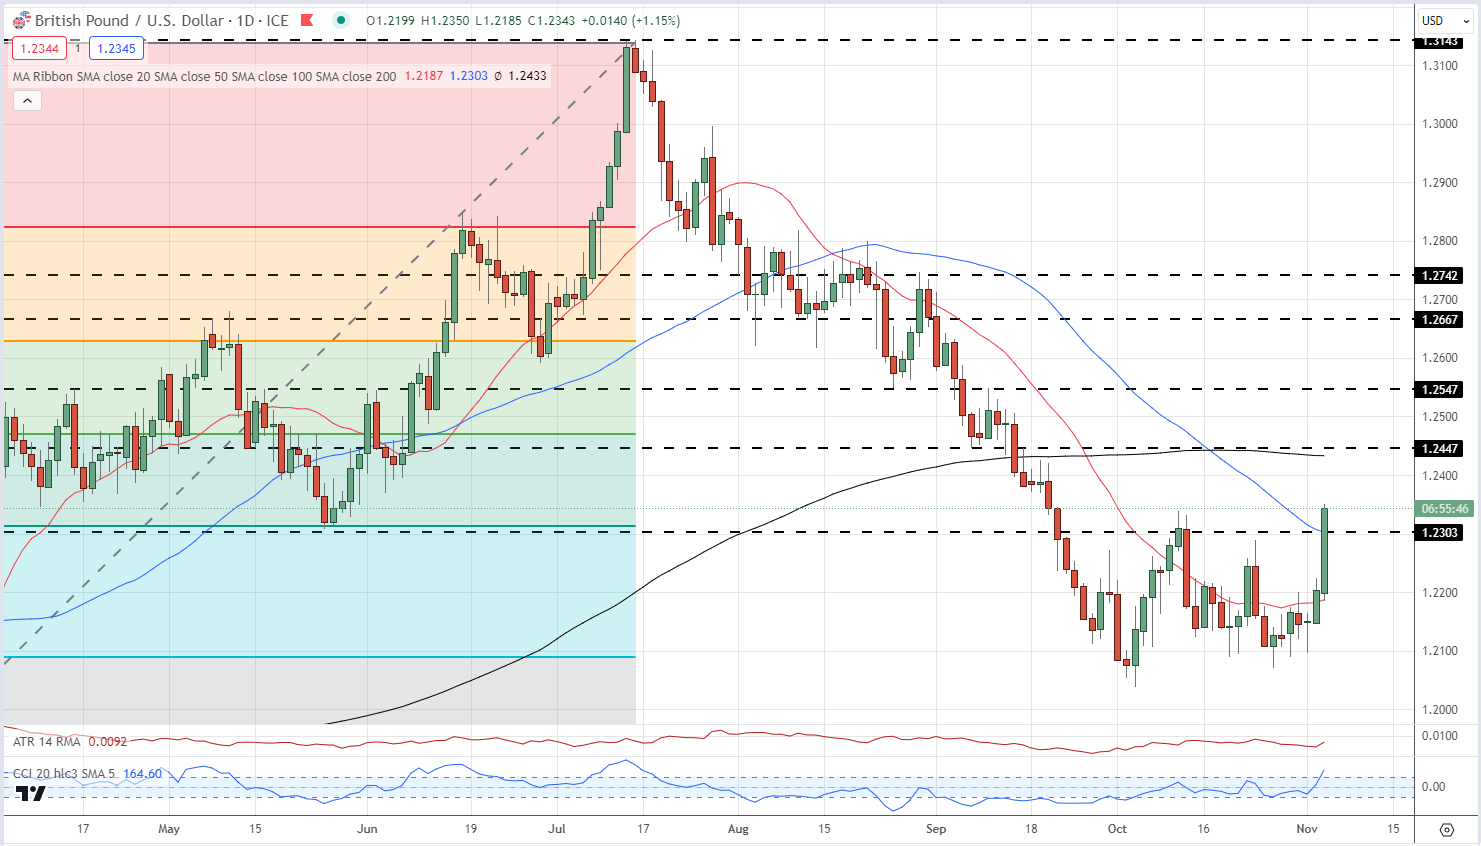
Chart via TradingView
Retail trader data shows 66.23% of traders are net-long with the ratio of traders long to short at 1.96 to 1.
How are GBP/USD Traders Currently Positioned and What Does it Mean for Price Action?
| Change in | Longs | Shorts | OI |
| Daily | -5% | -15% | -10% |
| Weekly | -10% | 3% | -5% |
What is your view on the British Pound – bullish or bearish?? You can let us know via the form at the end of this piece or you can contact the author via Twitter @nickcawley1.