
GBP/USD, EUR/GBP Analysis and Charts
- Cable falls to a three-month on renewed US dollar buying.
- EUR/GBP slides despite the ECB hiking rates again.
For all market-moving economic data and events, see the DailyFX Calendar

The ECB hiked interest rates higher by 25 basis points across the board but hinted that rates may remain unchanged in the coming months. Investors sold the Euro on the back of these comments in the Quarterly Staff Forecasts and the single currency is expected to remain under pressure in the coming weeks.
EUR Breaking News: ECB Hikes by 25bps, Hints Rates Have Peaked
The US Dollar Index gained on the back of Euro weakness and the greenback was given a secondary boost after strong US PPI and Retail Sales data.
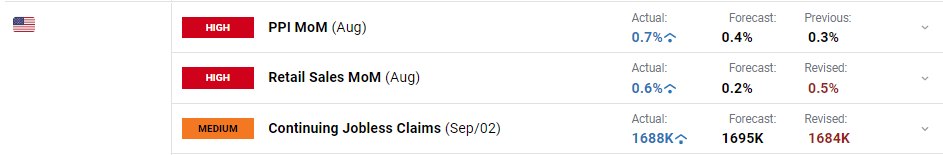
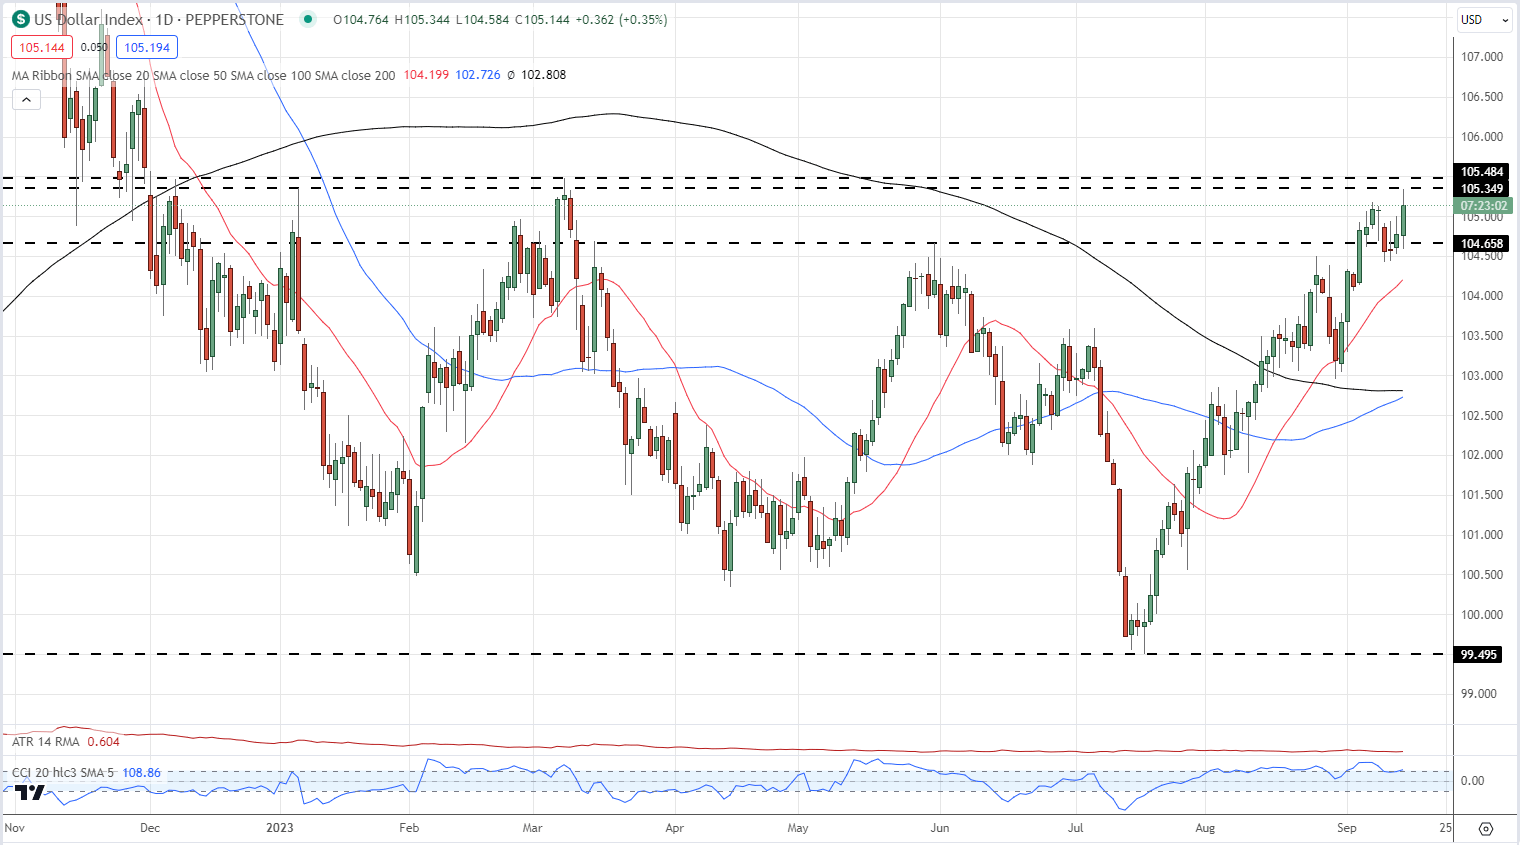
The combination of a weak Euro and stronger-than-expected US data pushed the dollar back to highs last seen in early March. The dollar’s rally off the double-bottom made in mid-June remains intact and a confirmed break above 105.48 could see the greenback move higher still.
US Dollar Index Daily Chart

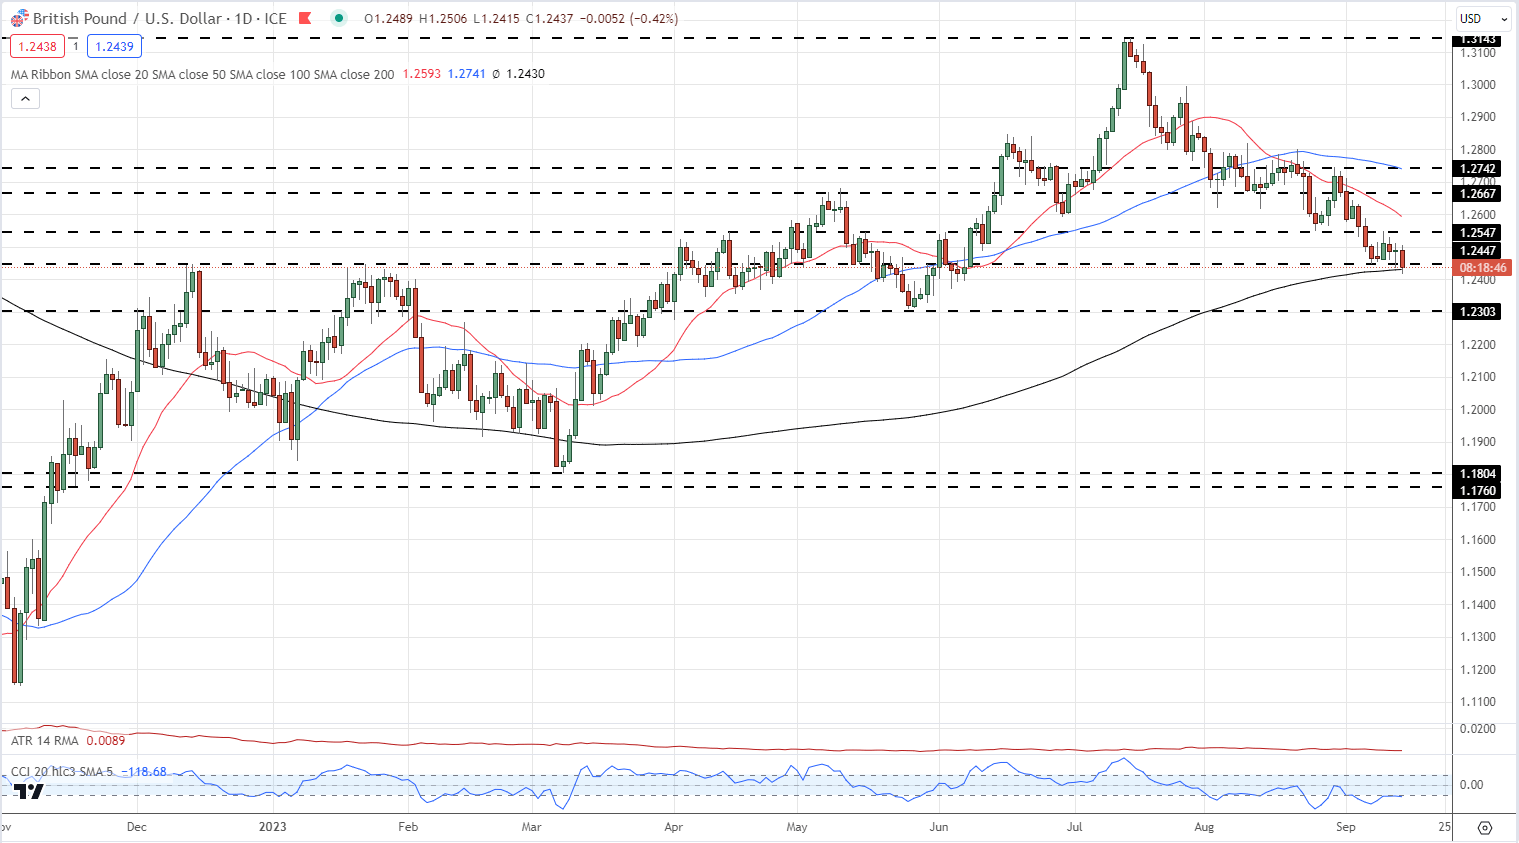
An already weak Sterling fell further against the US dollar, testing a prior level of support and touching levels last seen in early June. GBP/USD is now sitting at an important level with a break of resistance at 1.2447 bringing the 200-day simple moving average into play. A confirmed break below this indicator will increase pressure on Sterling and bring the late May swing-low at 1.2303 into play. Any move higher will find 1.2547 a difficult level of resistance to break under current market conditions.
GBP/USD Daily Price Chart
See How GBP/USD Traders are Currently Positioned
| Change in | Longs | Shorts | OI |
| Daily | 9% | 0% | 4% |
| Weekly | -21% | 14% | -3% |
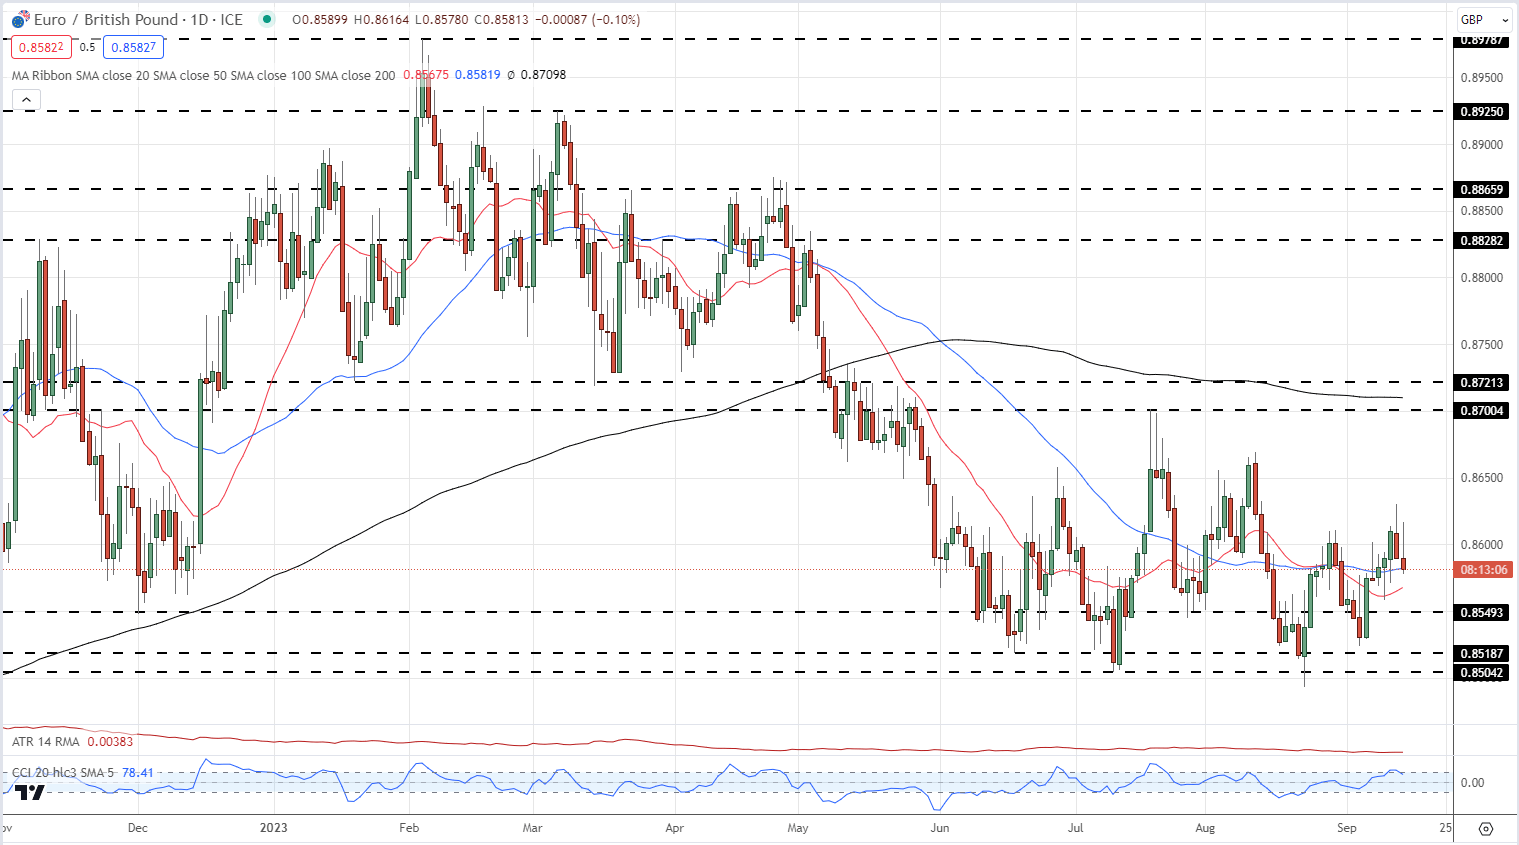
EUR/GBP is under pressure and continuing Wednesday’s weakness. There remains a wide 0.8500 to 0.8700 range in the pair and this looks likely to contain future price action. Within this range, the recent series of lower highs has been broken, lending the pair some support. The pair are now testing both the 20- and 50-day simple moving averages and a close and open below here would suggest lower prices in the days ahead. The Bank of England releases its latest monetary policy decision next week and this will be the next driver for EUR/GBP.
EUR/GBP Daily Price Chart
Charts using TradingView
What is your view on the British Pound – bullish or bearish?? You can let us know via the form at the end of this piece or you can contact the author via Twitter @nickcawley1.