
BITCOIN FORECAST
- Bitcoin prices extend recovery following news that EDX markets has launched
- With sentiment on the mend, BTC/USD has recaptured its 50-day simple moving average
- This article looks at bitcoin’s key technical levels to watch in the coming trading sessions

Most Read: Gold Prices Slump on US Data ahead of Powell’s Testimony, Key Support in Peril
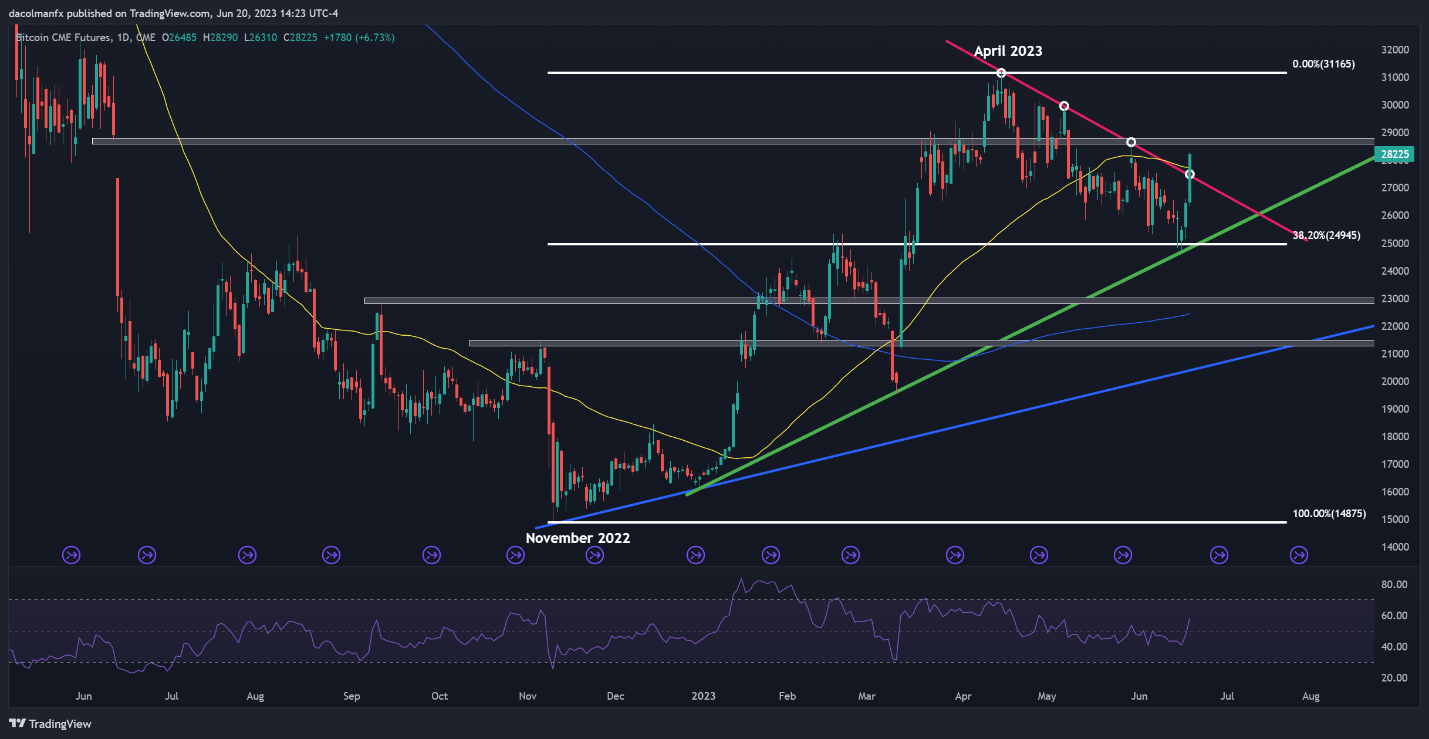
Soon after reaching multi-month highs above $31,000 in mid-April, bitcoin sold off aggressively, falling briefly below $25,000 late last week. The downward correction, however, appears to show tentative signs of having fully run its course, with sentiment stabilizing and dip-buyers returning, drawn to more attractive entry points.
The chart below reveals how the digital token has begun to recover after finding support near the psychological $25,000 threshold, where the 38.2% Fib retracement of the November 2022/April 2023 rally aligns with a medium-term trend line that has guided the market higher for nearly seven months.
The rebound gained momentum today after prices broke above dynamic resistance near $27,500 following news that EDX Markets, the cryptocurrency exchange backed by Citadel, Fidelity and Schwab, has launched operations, a move that signals renewed interest in digital assets.
From a technical standpoint, Tuesday’s breakout has pushed Bitcoin above its 50-day simple moving average, a positive development for trend watchers. If the bullish push is sustained, bulls may become embolden to challenge $28,700 soon. Upside clearance of this resistance could expose the 2023 highs.
On the flip side, if sellers regain the upper hand and spark a reversal, the first relevant support to keep in mind rests near $27,500. If this floor gives way, downward pressure could gather pace, setting the stage for a retest of the $25,000 area in short order.

BITCOIN TECHNICAL ANALYSIS