


The S&P 500 is very near long-term resistance ahead of the FOMC meeting. The DAX is also up against its own levels/lines of resistance that could see it either react lower or try and test the 2019 highs. Gold is working towards a potential breakdown, while the price of oil needs to digest the weekend gap.
Technical Highlights:
- S&P 500 near resistance of a few degrees
- DAX has a collection of lines standing in its way
- Gold on the brink of breaking, oil needs to sort itself out
Make more informed decisions by checking out our trading forecasts and educational resources on the DailyFX Trading Guides page.
S&P 500 near resistance of a few degrees
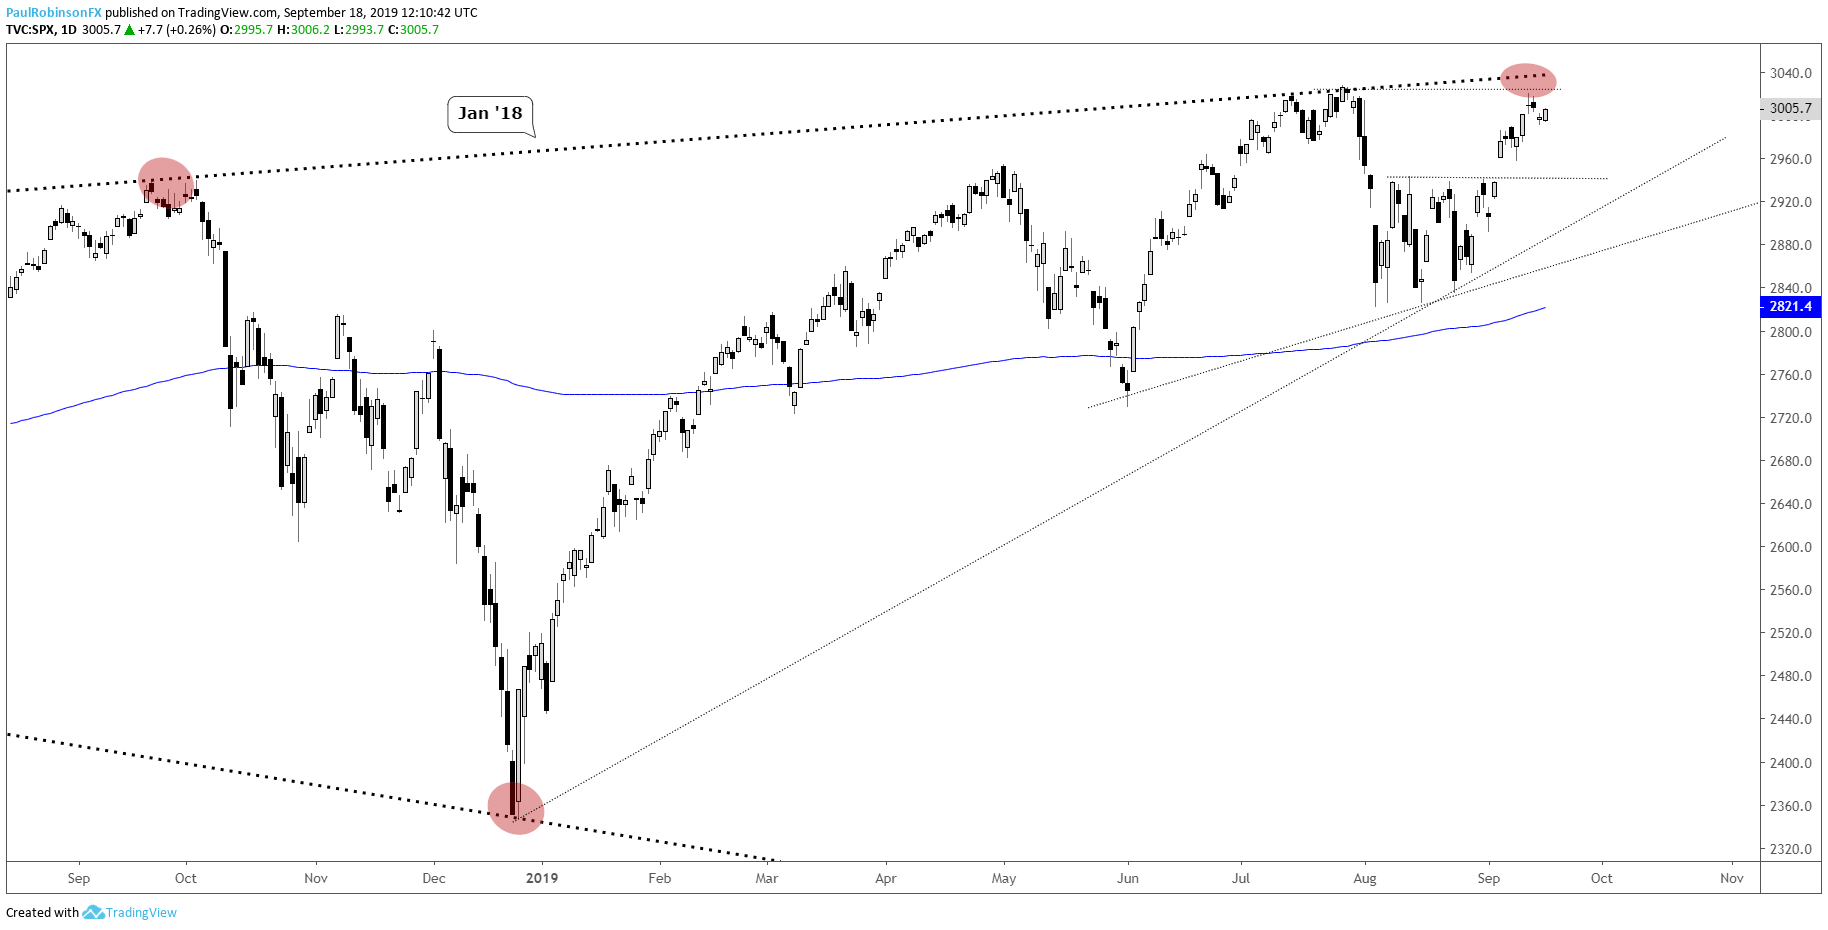
The S&P 500 has been hanging strong as of late, but with record highs near and the top-side trend-line from January 2018 only a short distance beyond there, the market is running out of room before it could potentially sell off again. Even if it is only a drop like in August it could bring a good short opportunity. First, though, need to see some bearish price action before running with it.
S&P 500 Daily Chart (resistance just ahead)
DAX has a collection of lines standing in its way
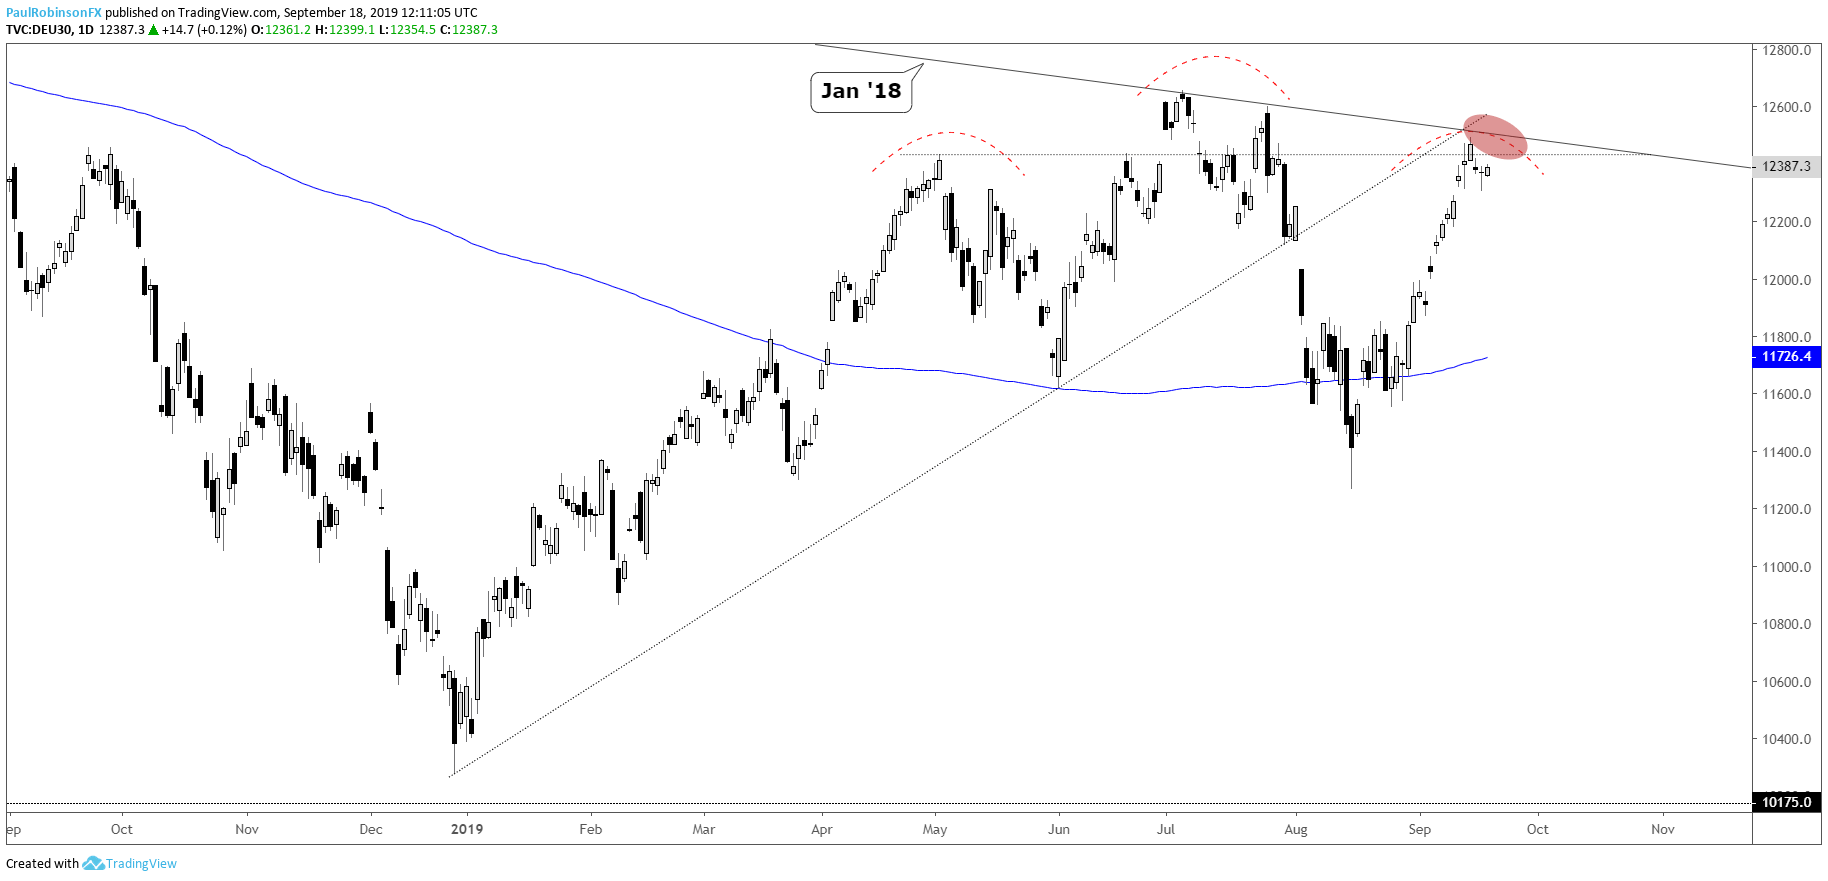
The DAX is trading around confluent resistance via the trend-line from the 2018 record high, what could be the left shoulder of a H&S top, and the underside of the trend-line running up from the December low. Watch how price action plays out up here. A hard rejection could be the cue ‘would-be’ shorts need to get the German benchmark rolling downhill.
DAX Daily Chart (around resistance)
Gold on the brink of breaking, oil needs to sort itself out
Gold is sitting on the lower channel line in place since late-May beneath the long-term levels created during the 2011/12 topping process. There is a head-and-shoulders pattern on the verge of triggering. A clean drop through 1484 will be considered the official trigger, with the 1450/30s area targeted. For more, check this earlier piece on gold price.
Gold Price Daily Chart (H&S on channel line)
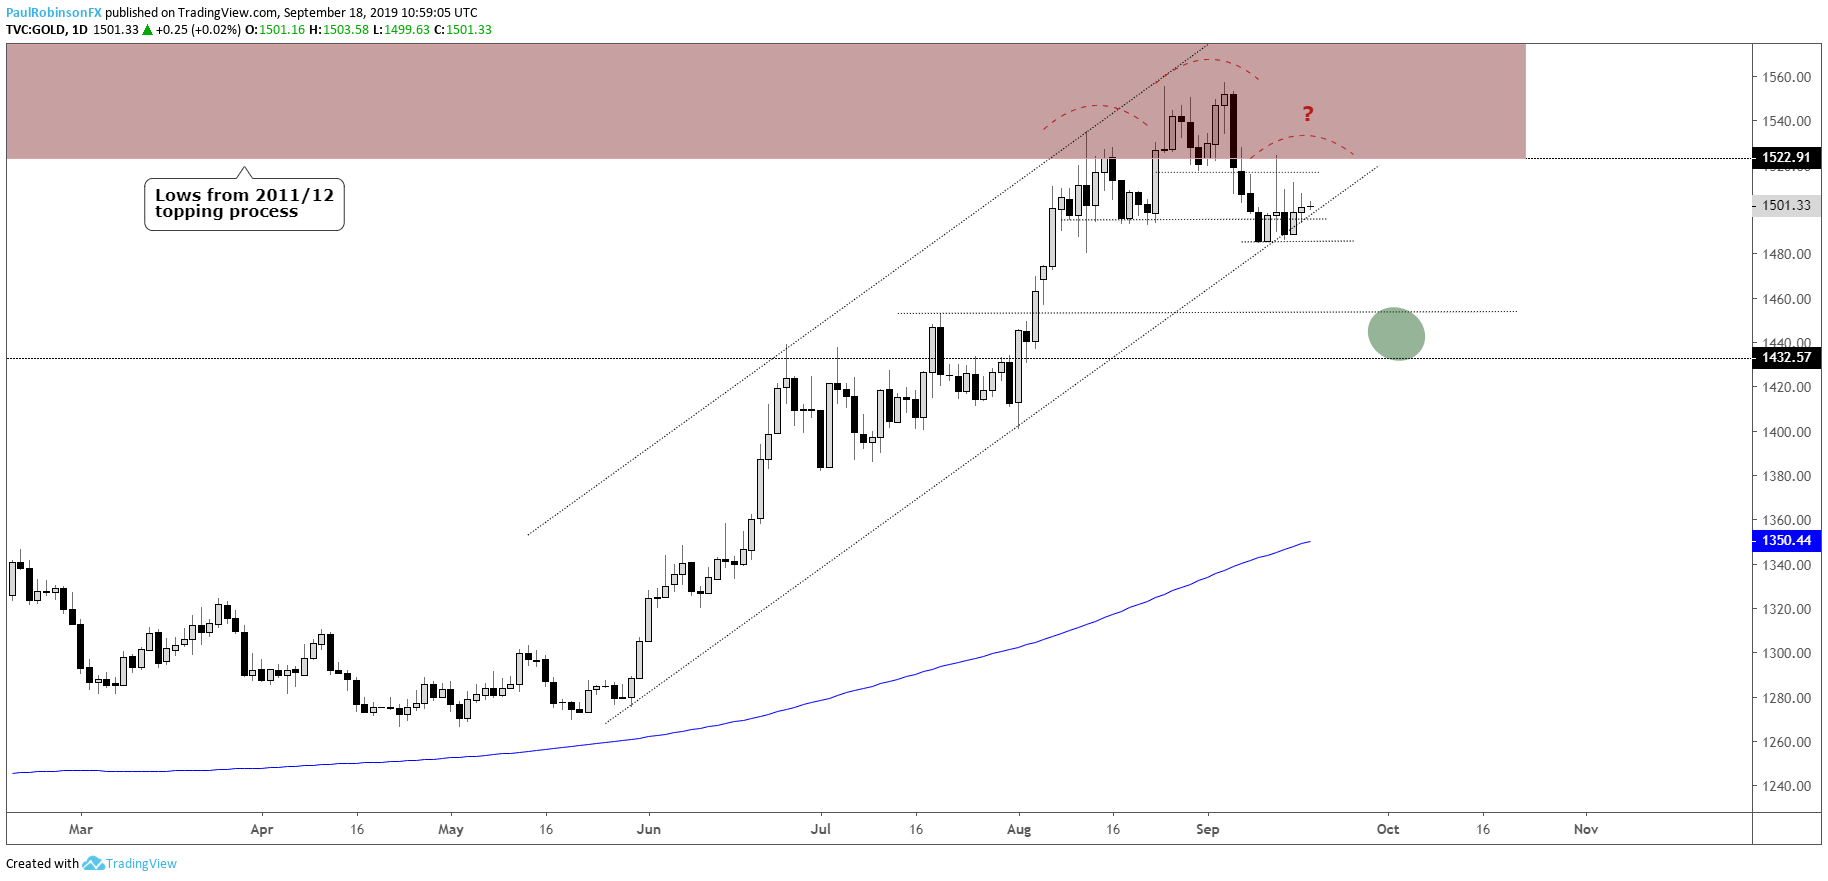
Gold Price Chart by Tradingview
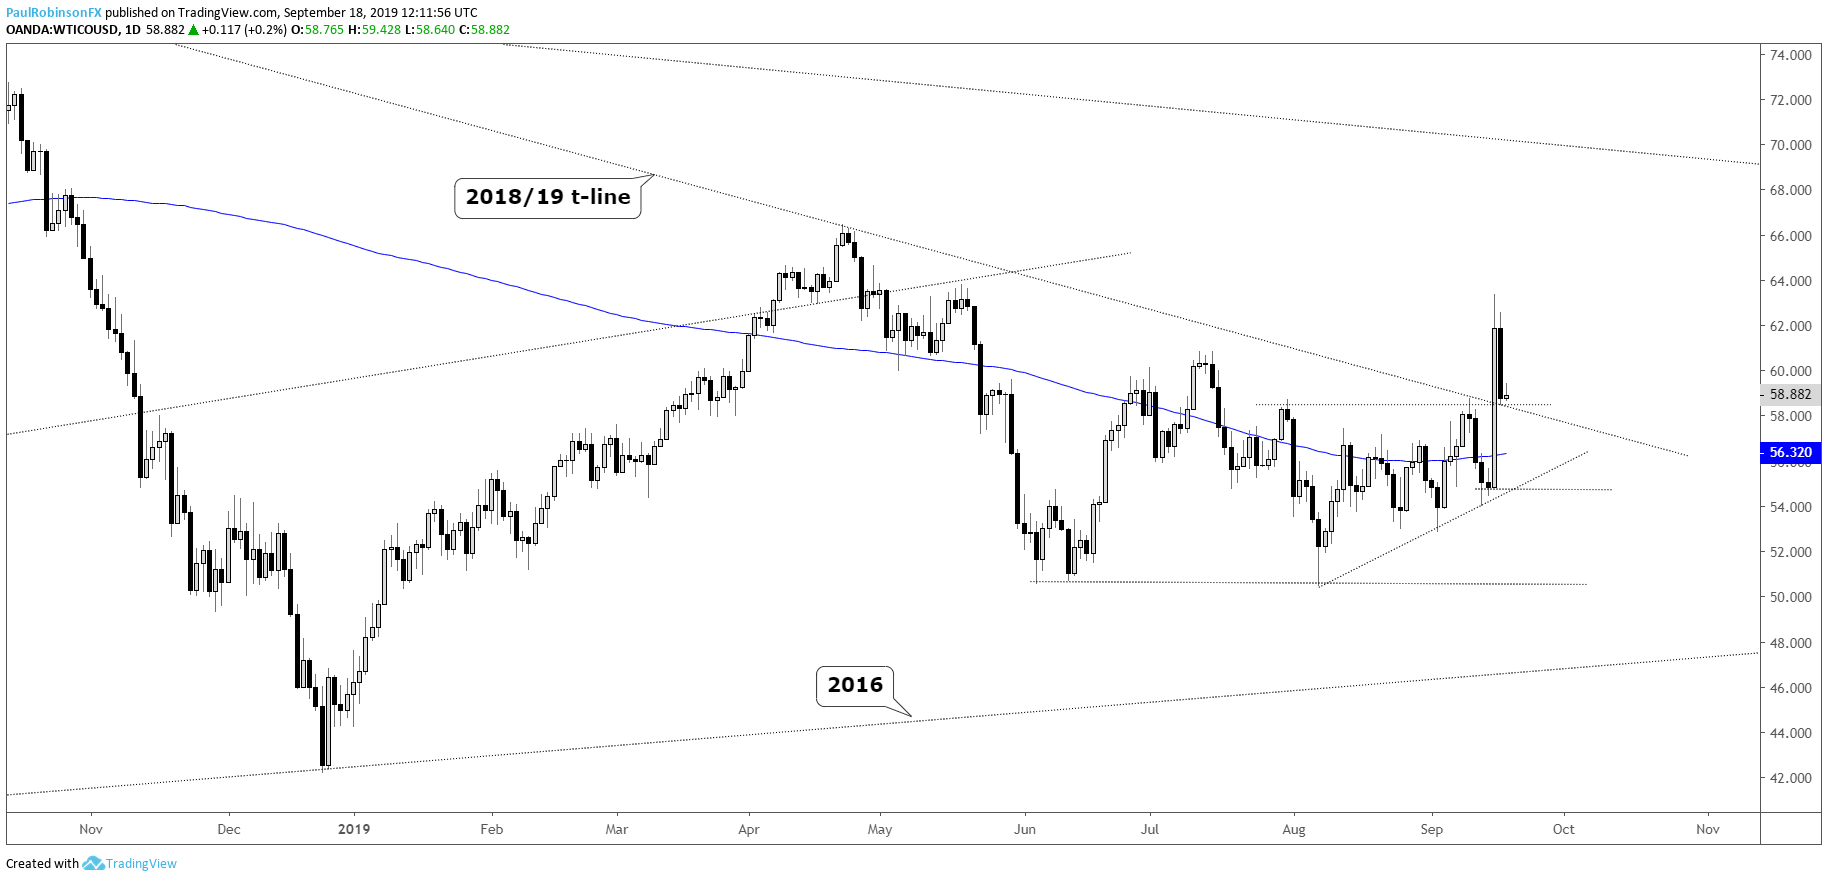
Crude oil gapped higher and rallied over 14% after the Saudi attack over the weekend. Price action has been difficult to discern lately, but that only made it even harder. For now on the sidelines, but watch for a full retracement to develop of the shot higher on Monday.
WTI Oil Daily Chart (sloppy, watch for a full retracement)
Resources for Index & Commodity Traders
Whether you are a new or an experienced trader, DailyFX has several resources available to help you; indicator for tracking trader sentiment, quarterly trading forecasts, analytical and educational webinars held daily, and trading guides to help you improve trading performance.
We also have a series of guides for those looking to trade specific markets, such as the S&P 500, Dow, DAX, gold, silver, crude oil, and copper.
---Written by Paul Robinson, Market Analyst
You can follow Paul on Twitter at @PaulRobinsonFX


