


Highlights:
- DXY posts fifth monthly decline and looks set to test May 2016 low
- EUR at strongest levels since January 2015, trades above 1.18 vs. USD and 1.14 vs. CHF
- Copper and Iron Ore echoes the Chinese economy after Strong China Industry PMI
- Sentiment Highlight: Crude Oil net-short positions rise ~94% week over week
While many traders look at the USD as a comedy of errors, there remains head scratching about EUR strength. Perhaps the most amazing thing about the EUR is that it could still by undervalued by ~14%. That was the view that the Organisation for Economic Co-operation and Development (OECD) suggested when releasing their purchasing-power parity (PPP) model. The OECD’s PPP was the basis that Chancellor Angela Merkel’s remarked in May when the common currency was trading at 1.12 that the currency was “too weak.” Now 600 pips higher, the OECD data stills show EUR is more undervalued than any Group-of-10 peer in purchasing-power parity terms, next only to GBP. EUR strength is equally shown against the CHF, which traded at a 30-month low against the EUR on Monday at 1.1434.
As you can see from the USD chart, “oversold” in and of itself, is often no reason to buy. In fact, any decent trend starts with a breakout that does not look back and the first validation of the breakout whether higher or lower is that the market has become oversold or overbought via recent technical studies, but continues in the breakouts direction. Such is the case for the US Dollar, which is working now on its biggest monthly losing streak since 2011. In 2011, the market was digesting the implications of a Federal Reserve that wasn’t expected to lift the reference rate off the zero-bound flow and was mired in QE programs that were uncertain to end.
Are you looking for trading ideas? Our Q3 forecasts are fresh and ready to light your path. Click here to access for FREE.
If commodity bulls in the base metals category need one thing to point at to help explain the recent strength, China will do just fine. At the start of the week, manufacturing data from China showed the expansion is continuing as evidenced by the steel industry’s purchasing manager’s index (PMI) for July showed the highest reading in 15-months. As the world’s largest iron-ore importer, China is helping to lift commodity currencies like the AUD, and we’ve also seen impressive strength in the off-shore Yuan thanks in no-small part to the decreased expectations that the Fed is paring back how much they will hike in coming years. Traders should keep an ear to Tuesday’s RBA meeting to see if they mention the sustained strength in China as a reason to possibly bring forward a rate hike, which could keep AUD riding high alongside EUR in G-10 FX.
JoinTylerin his Daily Closing Bell webinars at 3 pm ET to discuss tradeable market developments.
FX Closing Bell Top Chart: LT DXY shows price looks primed to test May 2016 low near 92.03
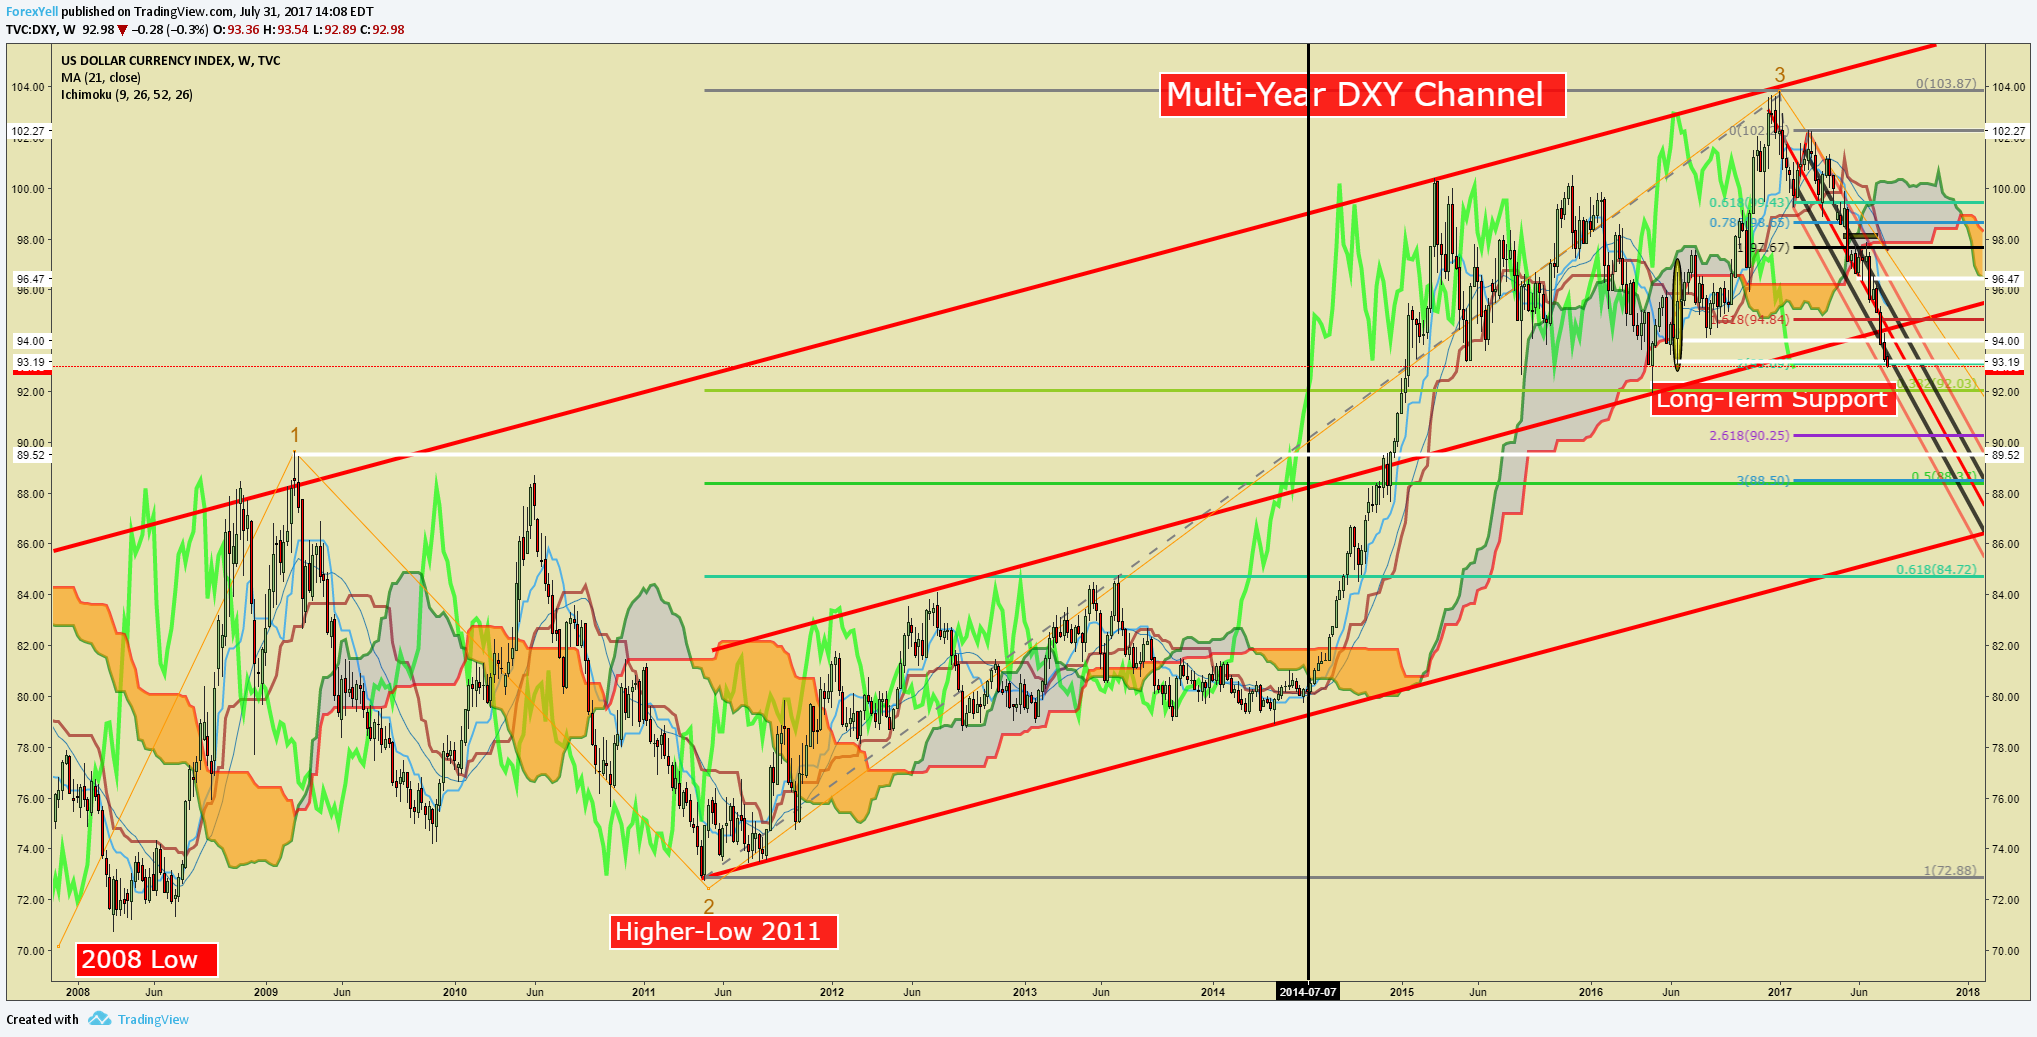
Chart Created by Tyler Yell, CMT
Next Week's Main Event: AUD Reserve Bank of Australia Rate Decision (AUG 01)
IG Client Sentiment Highlight: US Oil net short positions rise ~94% Week over Week
The sentiment highlight section is designed to help you see how DailyFX utilizes the insights derived from IG Client Sentiment, and how client positioning can lead to trade ideas. If you have any questions on this indicator, you are welcome to reach out to the author of this article with questions at tyell@dailyfx.com.

Oil - US Crude: Retail trader data shows 38.0% of traders are net-long with the ratio of traders short to long at 1.63 to 1. The percentage of traders net-long is now its lowest since Apr 02 when it traded near 5071.3. The number of traders net-long is 6.0% lower than yesterday and 41.2% lower from last week, while the number of traders net-short is 5.3% higher than yesterday and 93.9% higher from last week.
We typically take a contrarian view to crowd sentiment, and the fact traders are net-short suggests Oil - US Crude prices may continue to rise. Traders are further net-short than yesterday and last week, and the combination of current sentiment and recent changes gives us a stronger Oil - US Crude-bullish contrarian trading bias. (Emphasis mine)
---
Written by Tyler Yell, CMT, Currency Analyst & Trading Instructor for DailyFX.com
To receive Tyler's analysis directly via email, please SIGN UP HERE
Contact and discuss markets with Tyler on Twitter: @ForexYell


