


Gold Price Outlook:
- Gold prices are making strides as US real yields fall back.
- However, until gold prices break the downtrend from the March and August swing highs, the rally should be viewed with some trepidation.
- Gold prices have a mixed bias in the near-term, according to the IG Client Sentiment Index.

Real Yields Fall Back
Gold prices are finding life anew at the end of October as a tumble in US real yields is helping make precious metals look relatively more appealing. The US 10-year real yield has fallen back from 1.815% last week to under 1.500% today, thanks in part to a drop in US Treasury yields and a rise in US inflation expectations (via-a-vis breakeven rates). Coupled with US Dollar (via the DXY Index) weakness, gold prices are starting to show signs of a technical turnaround, with early indications that a double bottom may be forming.
Gold Volatility Ebbs, Gold Prices Rally
Historically, gold prices have a relationship with volatility unlike other asset classes. While other asset classes like bonds and stocks don’t like increased volatility – signaling greater uncertainty around cash flows, dividends, coupon payments, etc. – gold tends to benefit during periods of higher volatility. Gold volatility has proved stable, and as US yields (both nominal and real) and the US Dollar fall back, gold prices have been afforded room to rally.
GVZ (Gold Volatility) Technical Analysis: Daily Price Chart (October 2021 to October 2022) (Chart 1)
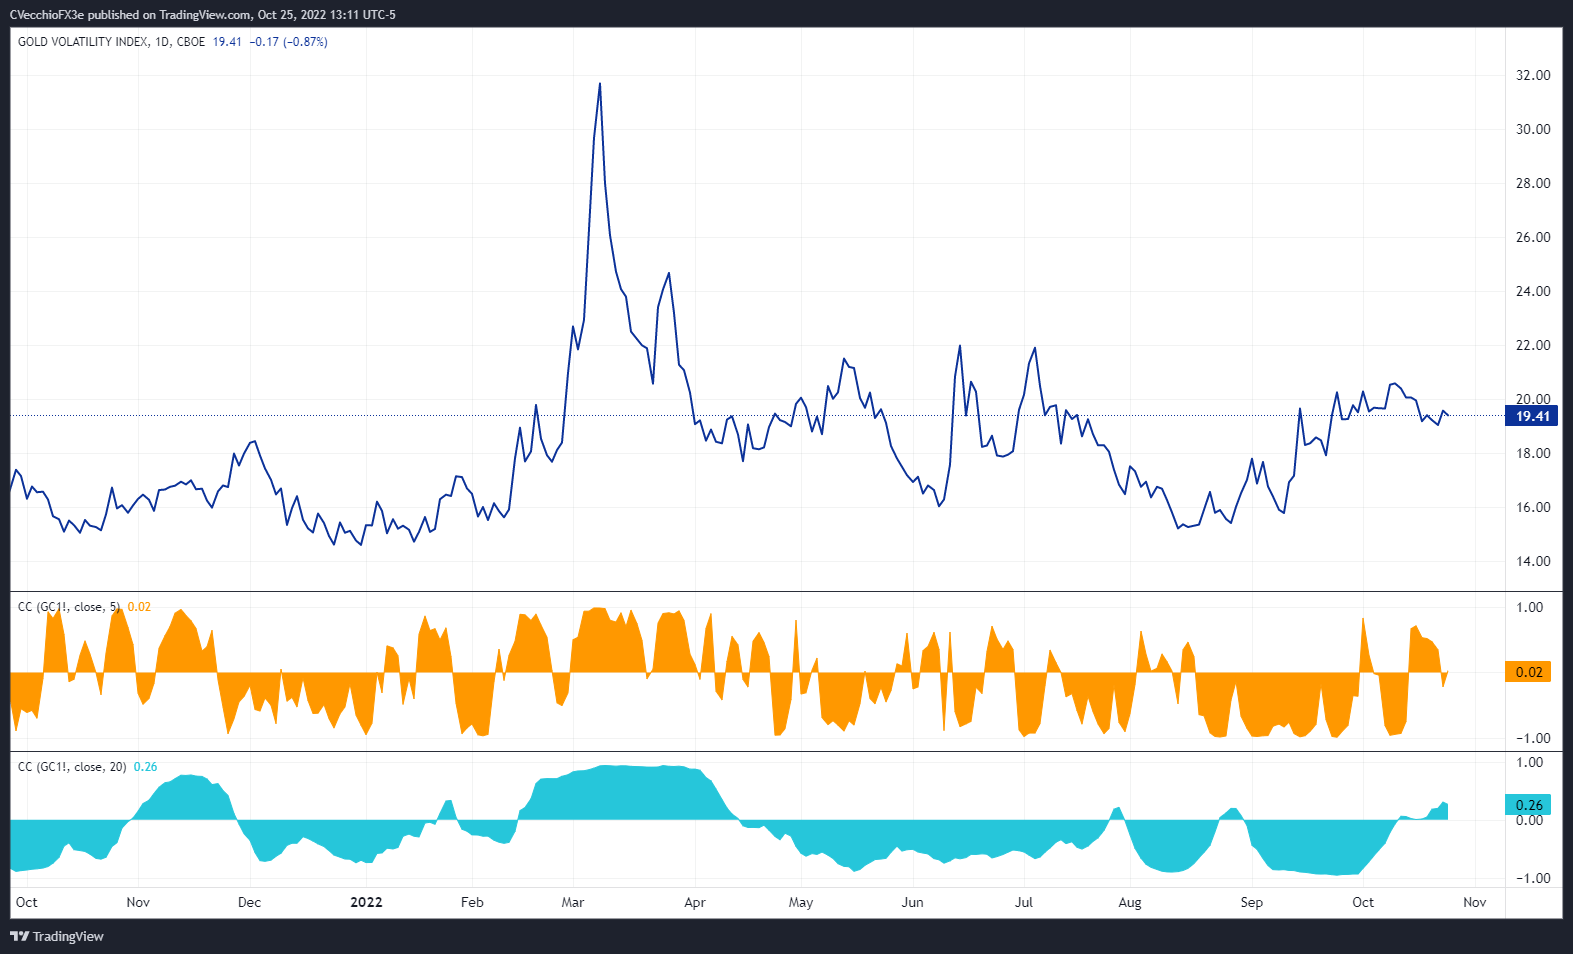
Gold volatility (as measured by the Cboe’s gold volatility ETF, GVZ, which tracks the 1-month implied volatility of gold as derived from the GLD option chain) was trading at 19.41 at the time this report was written. The 5-day correlation between GVZ and gold prices is +0.02 while the 20-day correlation is +0.26. One week ago, on October 18, the 5-day correlation was +0.53 and the 20-day correlation was +0.01.
Gold Price Rate Technical Analysis: Daily Chart (October 2021 to October 2022) (Chart 2)
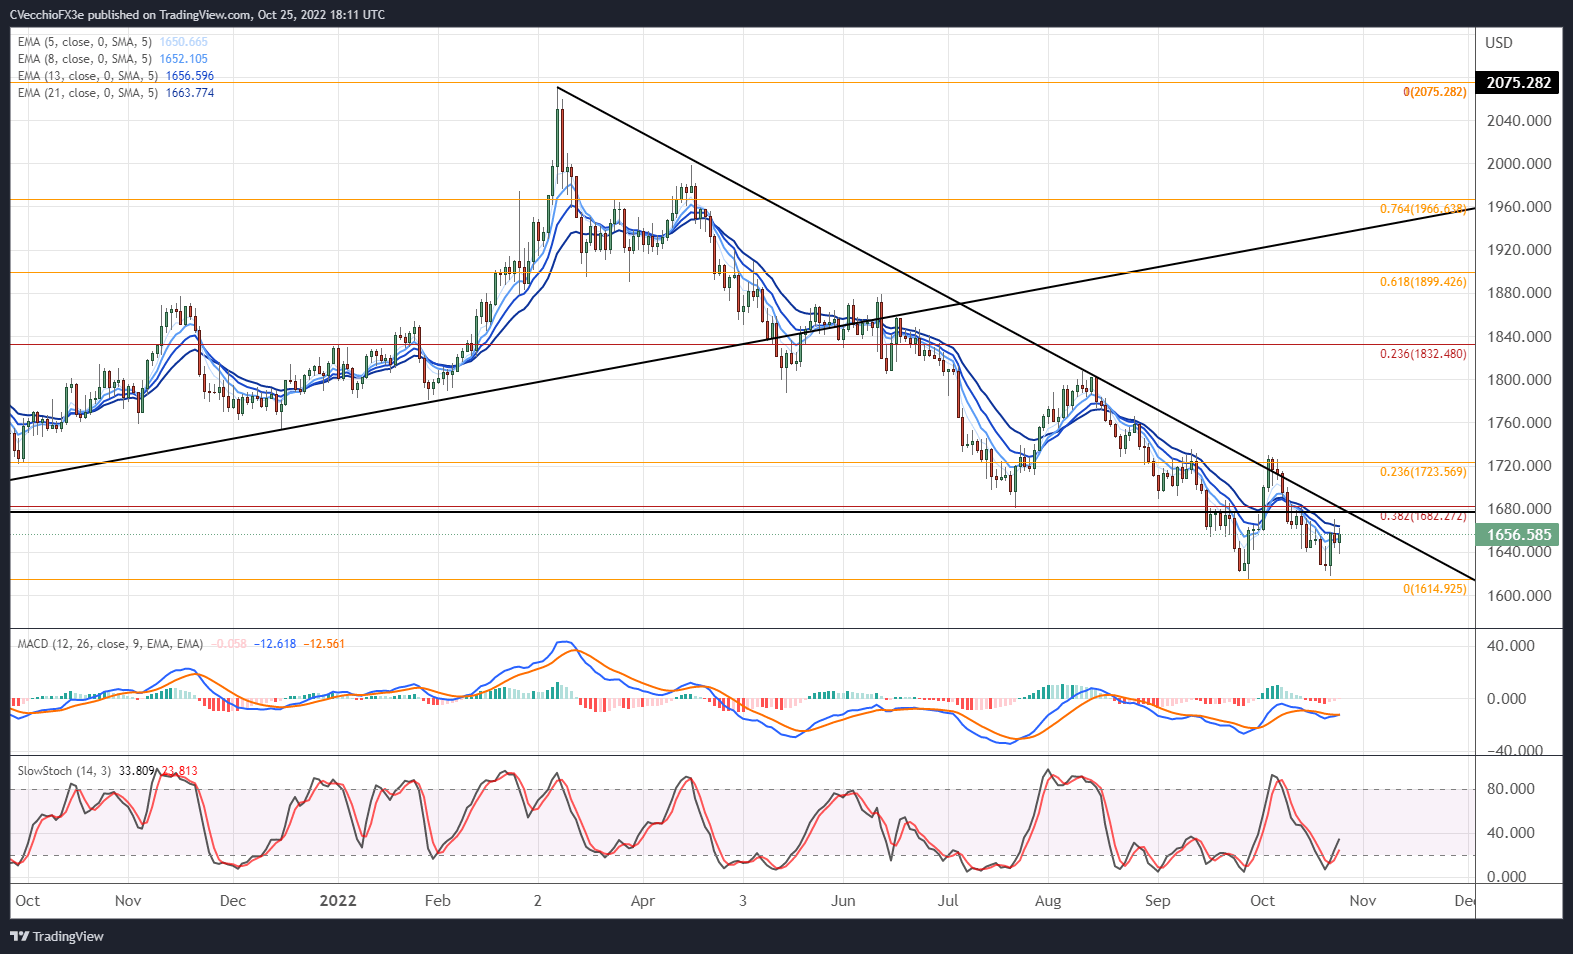
There are two meaningful observations for gold prices in the near-term. First, a double bottom may be formed against 1614/17, buttressed by the morning star candlestick pattern at the end of last week. This suggests a more bullish outlook moving forward. Second, however, it remains the case that “another run to the descending trendline from the March and August highs is possible, but until the downtrend breaks, it’s difficult to have faith in a meaningful rally by gold prices.” Until the second condition is fulfilled – the multi-month downtrend breaks – then the double bottom potential remains constrained.
Patience is needed, but it remains the case that “a move above the area around 1680 by the end of October would see gold prices trade back above former multi-month support (turned resistance) and break the downtrend in place from the March and August highs.”
Gold Price Technical Analysis: Weekly Chart (October 2015 to October 2022) (Chart 3)
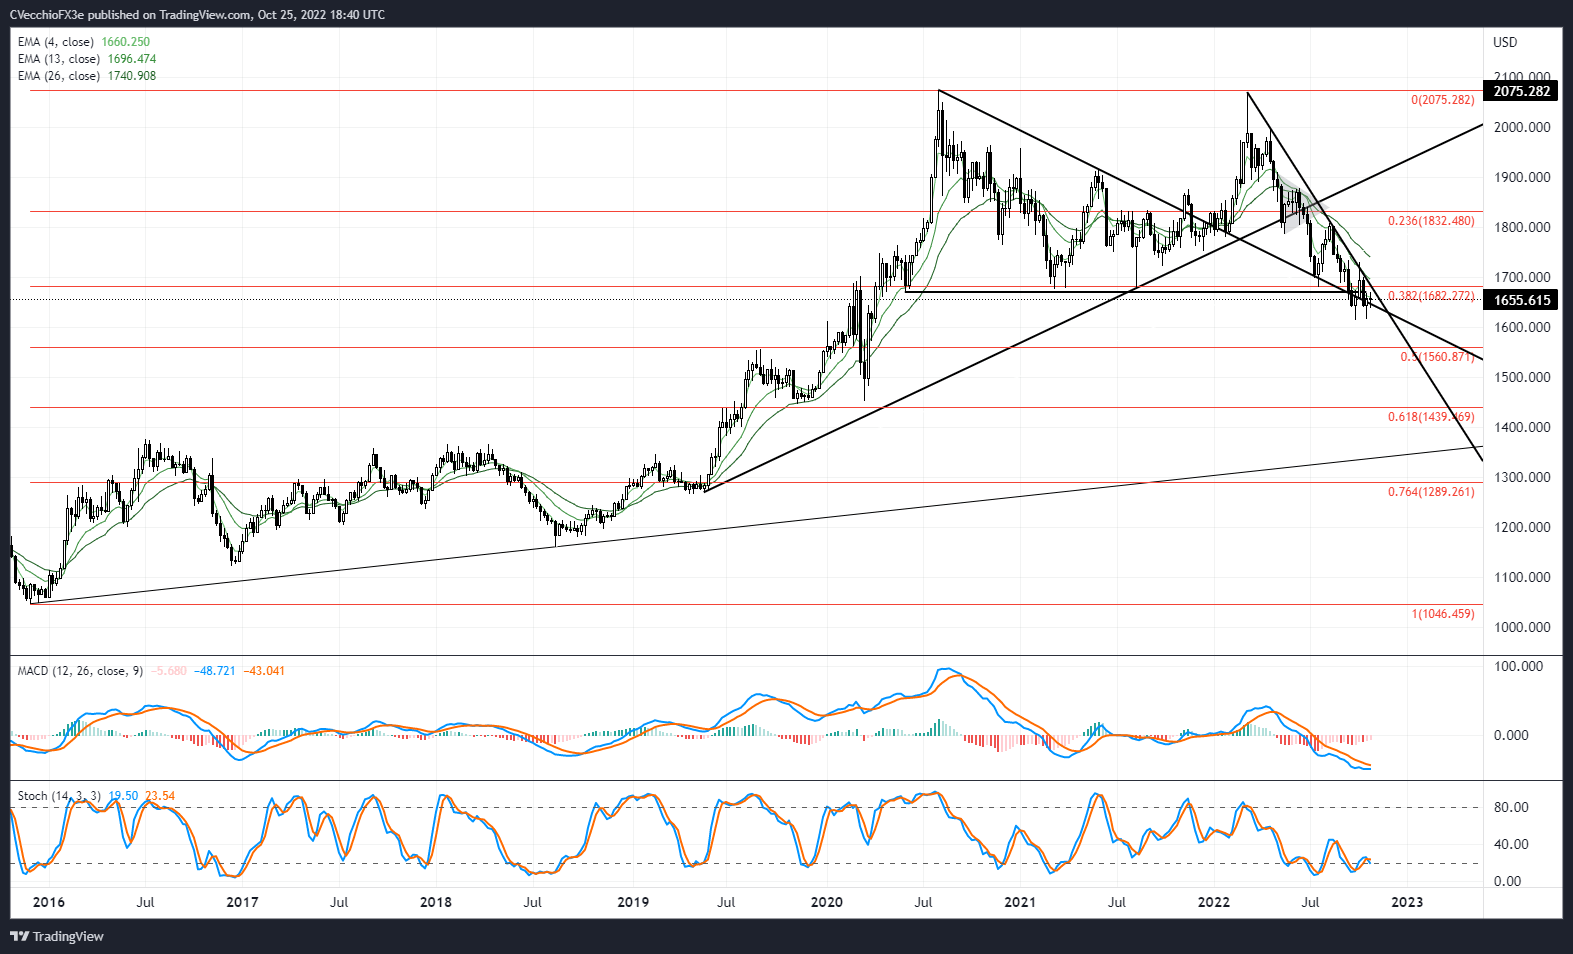
The longer-term view remains unchanged as no significant progress has been made on the weekly timeframe: “a double top remains in place, but a quadruple bottom around 1680 warrants a reconsideration: a massive sideways range between 1680 and 2075 may have formed. A bounce from 1680 sees 1800 as the first area before resistance is found. The sudden shift in the environment suggests that the daily timeframe (and lower, like the 4-hour timeframe) will be better suited to pay attention to over the coming days/weeks as it will take a long time for technical indicators to evolve on the weekly timeframe.”

IG CLIENT SENTIMENT INDEX: GOLD PRICE FORECAST (October 25, 2022) (Chart 4)
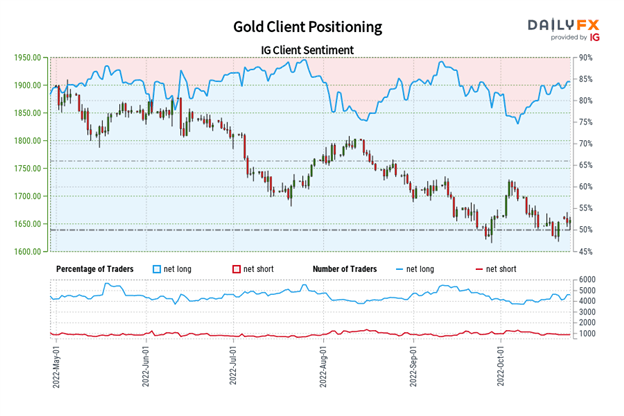
Gold: Retail trader data shows 83.92% of traders are net-long with the ratio of traders long to short at 5.22 to 1. The number of traders net-long is 0.35% lower than yesterday and 3.76% higher from last week, while the number of traders net-short is 4.93% higher than yesterday and 14.26% lower from last week.
We typically take a contrarian view to crowd sentiment, and the fact traders are net-long suggests Gold prices may continue to fall.
Positioning is less net-long than yesterday but more net-long from last week. The combination of current sentiment and recent changes gives us a further mixed Gold trading bias.
Trade Smarter - Sign up for the DailyFX Newsletter
Receive timely and compelling market commentary from the DailyFX team
--- Written by Christopher Vecchio, CFA, Senior Strategist


