


Gold Technical Outlook:
- Gold is backing off from record highs, may need to digest recent gains
- Silver could go into pullback mode if technical pattern triggers

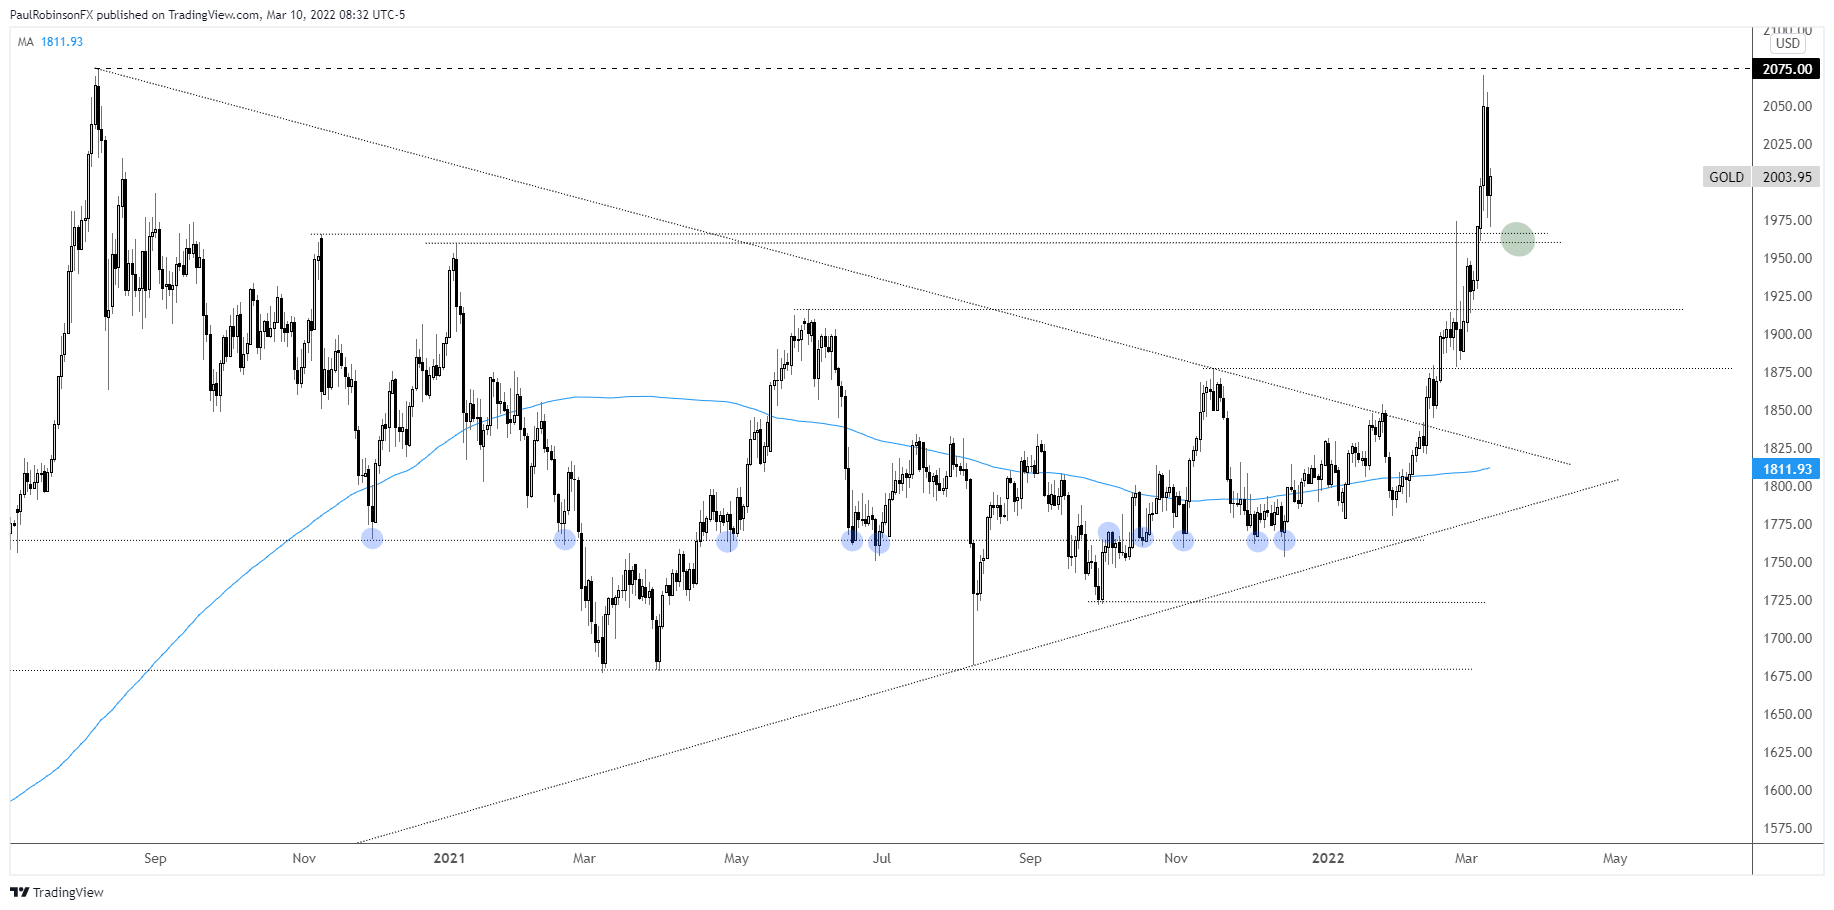
Gold price nearly tagged the record high at 2075 on Tuesday, falling short by just a few handles. The recent shot higher came on panicky price action in other risk markets. Yesterday’s sharp decline doesn’t mean the big picture rally is over (thinking it just started), but could mean a pause is in store.
Sideways movement would do gold some good to work off the recent surge and any accompanying overbought conditions it has brought with it. It shouldn’t come as too much of a surprise that the record high not seen since the middle of 2020 was an issue to overcome on first passing.
There is some support to watch around the 1960s, that could put in a floor on a retracement. A large consolidation between the 1960s and 2075 would be ideal in terms of setting up for a breakout. We shall see. For now, as per the short-term I am taking a bit of a wait-and-see approach.
Looking at the big-picture, gold has been winding up for what looks like another major bull leg higher that could take it to considerable heights…

Gold Daily Chart
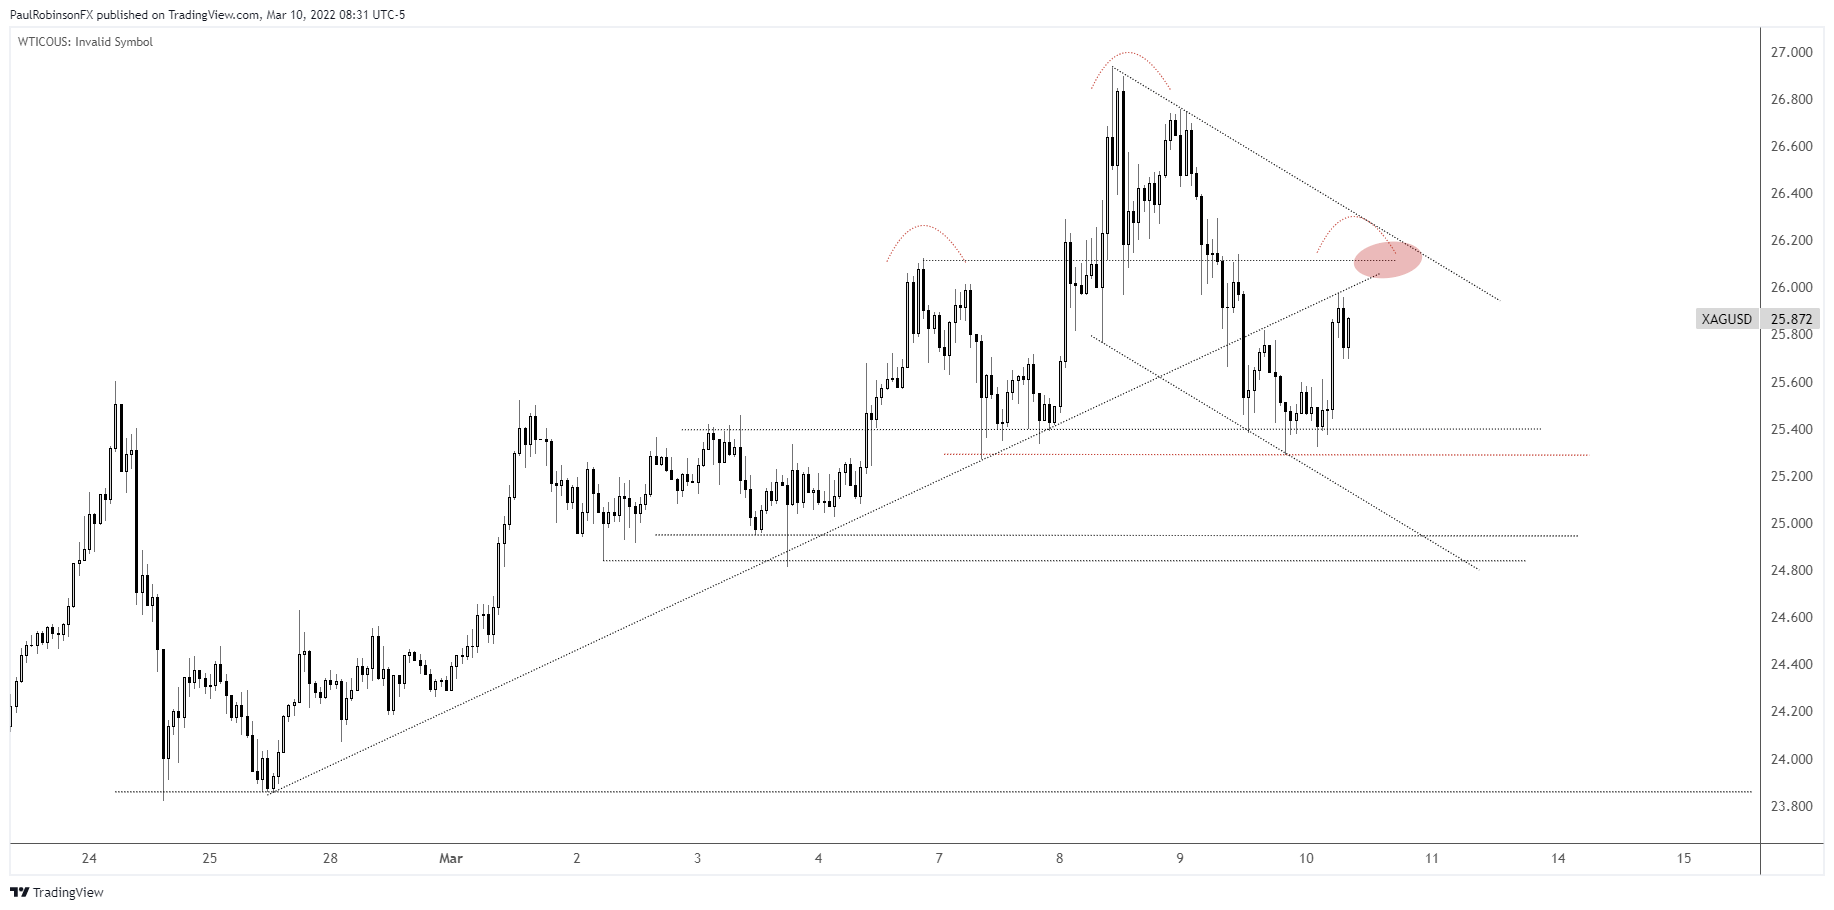
Silver price action, while not developing around as meaningful of a level as gold, suggests it could head lower in the near-term. The hourly chart shows a developing head-and-shoulders pattern. We will need to see a breakdown below the neckline at 25.73. The area surrounding this level is solid, so an hourly close below support will be needed to kick off the pattern.
If we see a confirmed breakdown the next area of support to watch arrives around 24.95/85. There are a pair of swing-lows created in early March in confluence with a lower parallel. The height of the H&S formation suggests a larger move towards the late Feb lows around 23.80 could unfold.
If we don’t see the down-side come into play, then firming up of price action could at some point negate the bearish implications of the H&S pattern. Keep an eye on the upper parallel off the recent high, the would-be left shoulder at 26.12, and underside of the Feb 25 trend-line as a strong spot of confluent resistance.
Silver Hourly Chart
Resources for Forex Traders
Whether you are a new or experienced trader, we have several resources available to help you; indicator for tracking trader sentiment, quarterly trading forecasts, analytical and educational webinars held daily, trading guides to help you improve trading performance, and one specifically for those who are new to forex.
---Written by Paul Robinson, Market Analyst
You can follow Paul on Twitter at @PaulRobinsonFX


