Gold/Silver Price Technical Outlook
- Gold held support yesterday, looks poised to trade higher soon
- Silver staying within the confines of a bullish channel
Gold & Silver Price Analysis: XAU & XAG Charts Looking Bullish
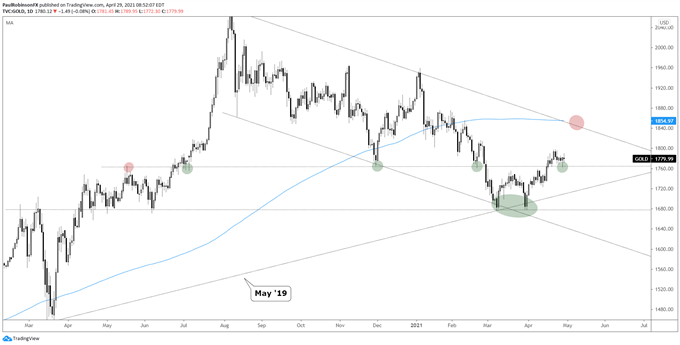
Yesterday, gold tagged and reversed off support around 1764, a level that has been in play since May of last year. It acted as resistance then, but turned into a source of support since, with it acting as a floor of some sort in November and February.
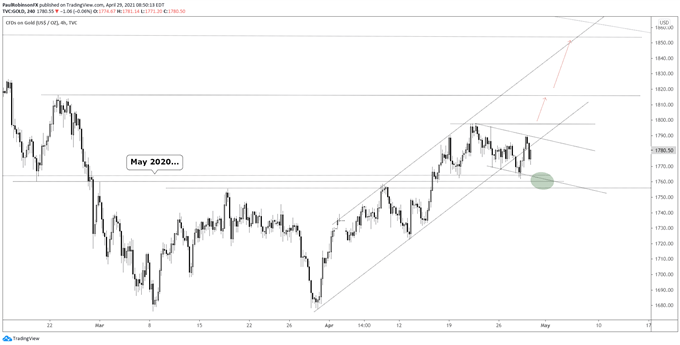
Yesterday’s reversal off that low within the context of an upward trend from late March keeps the upside intact, even if the neat channel was broken on the 4-hr chart. Just because a channel breaks it doesn’t necessarily signal a trend change as long as the break isn’t accompanied by strong momentum.
We may see a bit of a bull-flag develop on the 4-hr chart, but even if we don’t see a neat configuration form, as long as yesterday’s low at 1762 holds the outlook is looking positive. The first level of resistance to watch is the 1797 high from recently, then 1816, a short-term swing-high from February.
The broader target in the near-term is the August trend-line (~1840s) and the 200-day moving average at 1854. These two thresholds could intersect to create an influential spot of confluence. We shall have to wait and see, of course.


Gold Daily Chart (1764 support)

Gold 4-hr Chart (bullish even if outside channel)

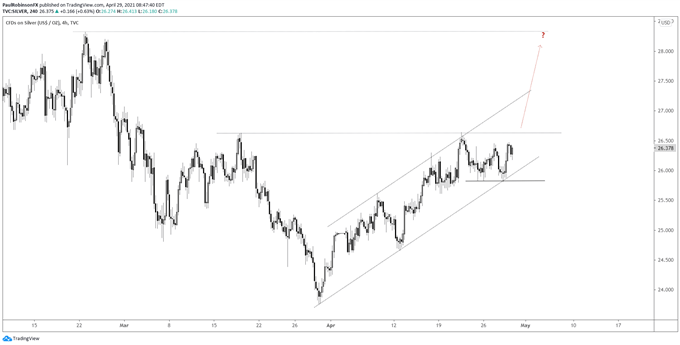
Silver is looking solid within the confines of a neat channel dating to late March. The 4-hr chart has a clean set of lines to watch. The lower parallel is seen as support on weakness, with yesterday’s low at 25.81 viewed as the ‘line-in-the-sand.’
A breakout above 26.64 is needed to get things rolling higher. Beyond that point there isn’t any visible resistance until a swing high from February in the 28.30s.
Silver 4-hr Chart (channel heading towards breakout)

Resources for Forex Traders
Whether you are a new or experienced trader, we have several resources available to help you; indicator for tracking trader sentiment, quarterly trading forecasts, analytical and educational webinars held daily, trading guides to help you improve trading performance, and one specifically for those who are new to forex.
---Written by Paul Robinson, Market Analyst
You can follow Paul on Twitter at @PaulRobinsonFX


