


Gold Price - XAU/USD Technical Outlook
- Bullish signals spotted on XAU/USD Chart
- Levels and key trading zones to watch
XAU/USD Price – Bulls Hold Fire
On Friday, Gold rallied to $1,575 – its highest level in two week then closed the weekly candlestick in the green with 0.9% gain. This week, the market resumed trading higher and printed $1,588.
The Relative Strength Index (RSI) pointed lower from 68 to 60 then remained flat after highlighting a paused uptrend momentum.
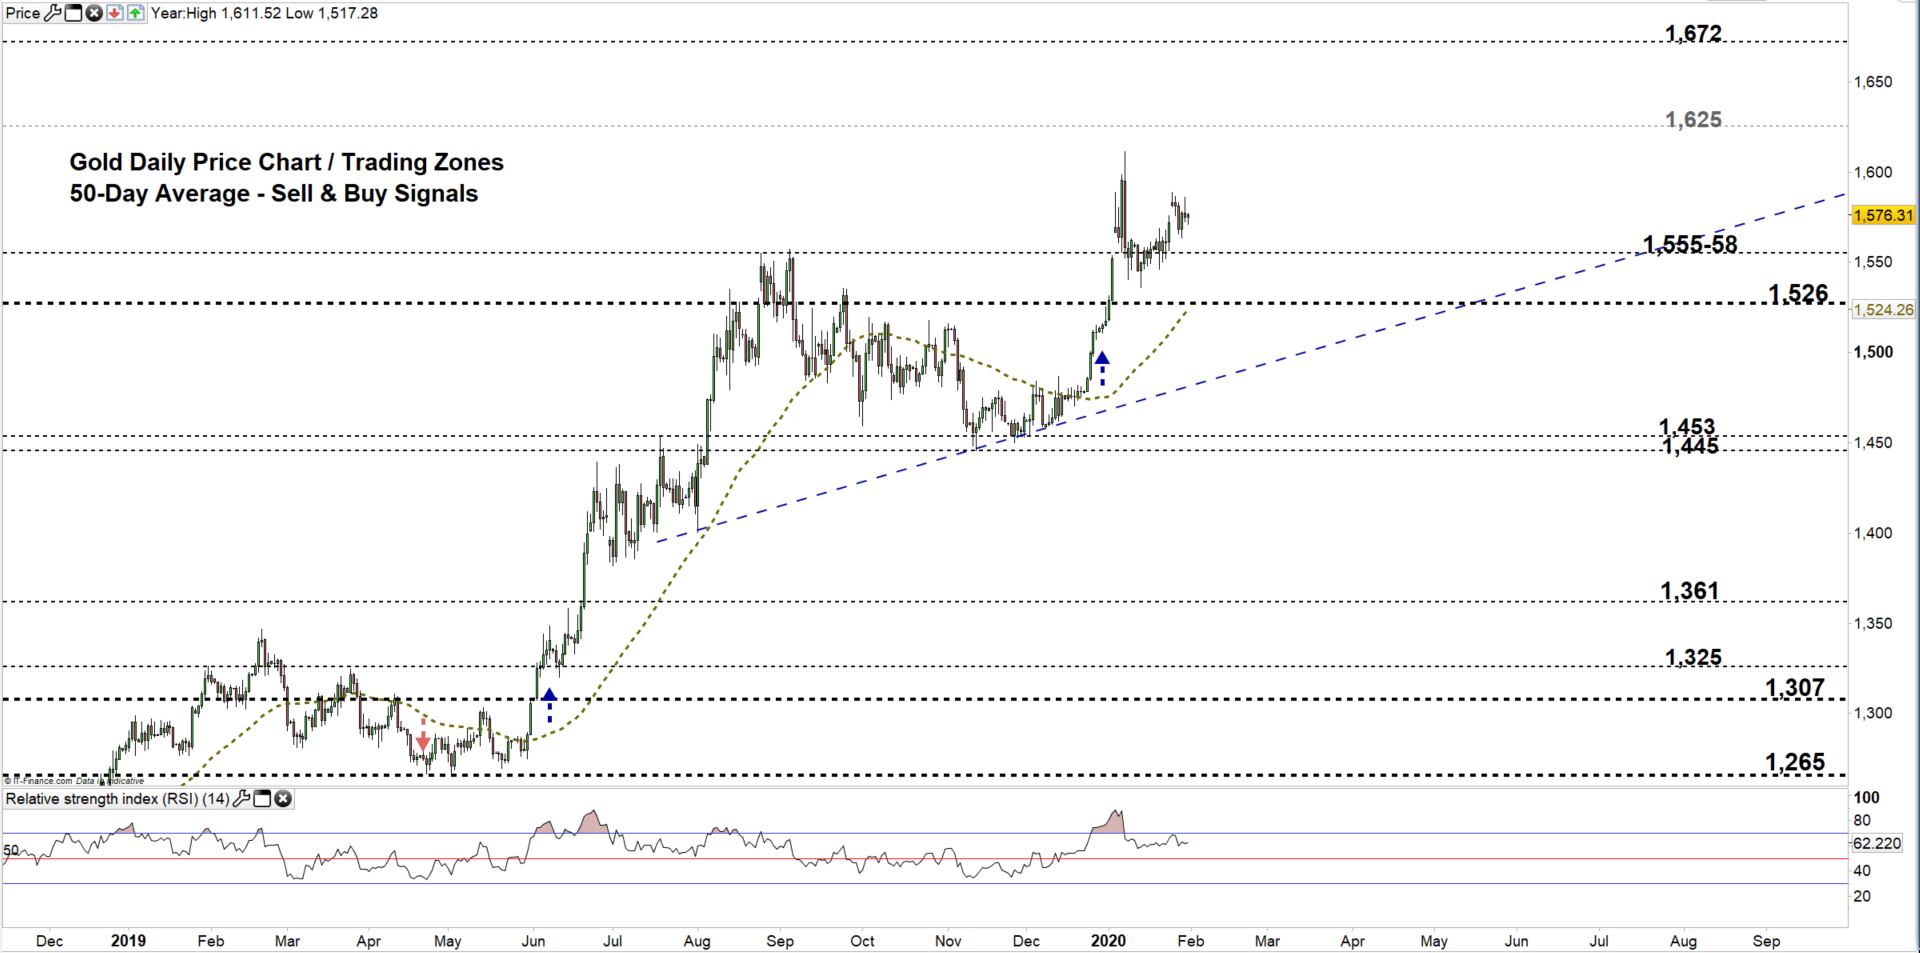
Gold DAILY PRICE CHART (MaY 31, 2018 – Jan 31, 2020) Zoomed out

Gold DAILY PRICE CHART (July 31 – Jan 31, 2020) Zoomed In
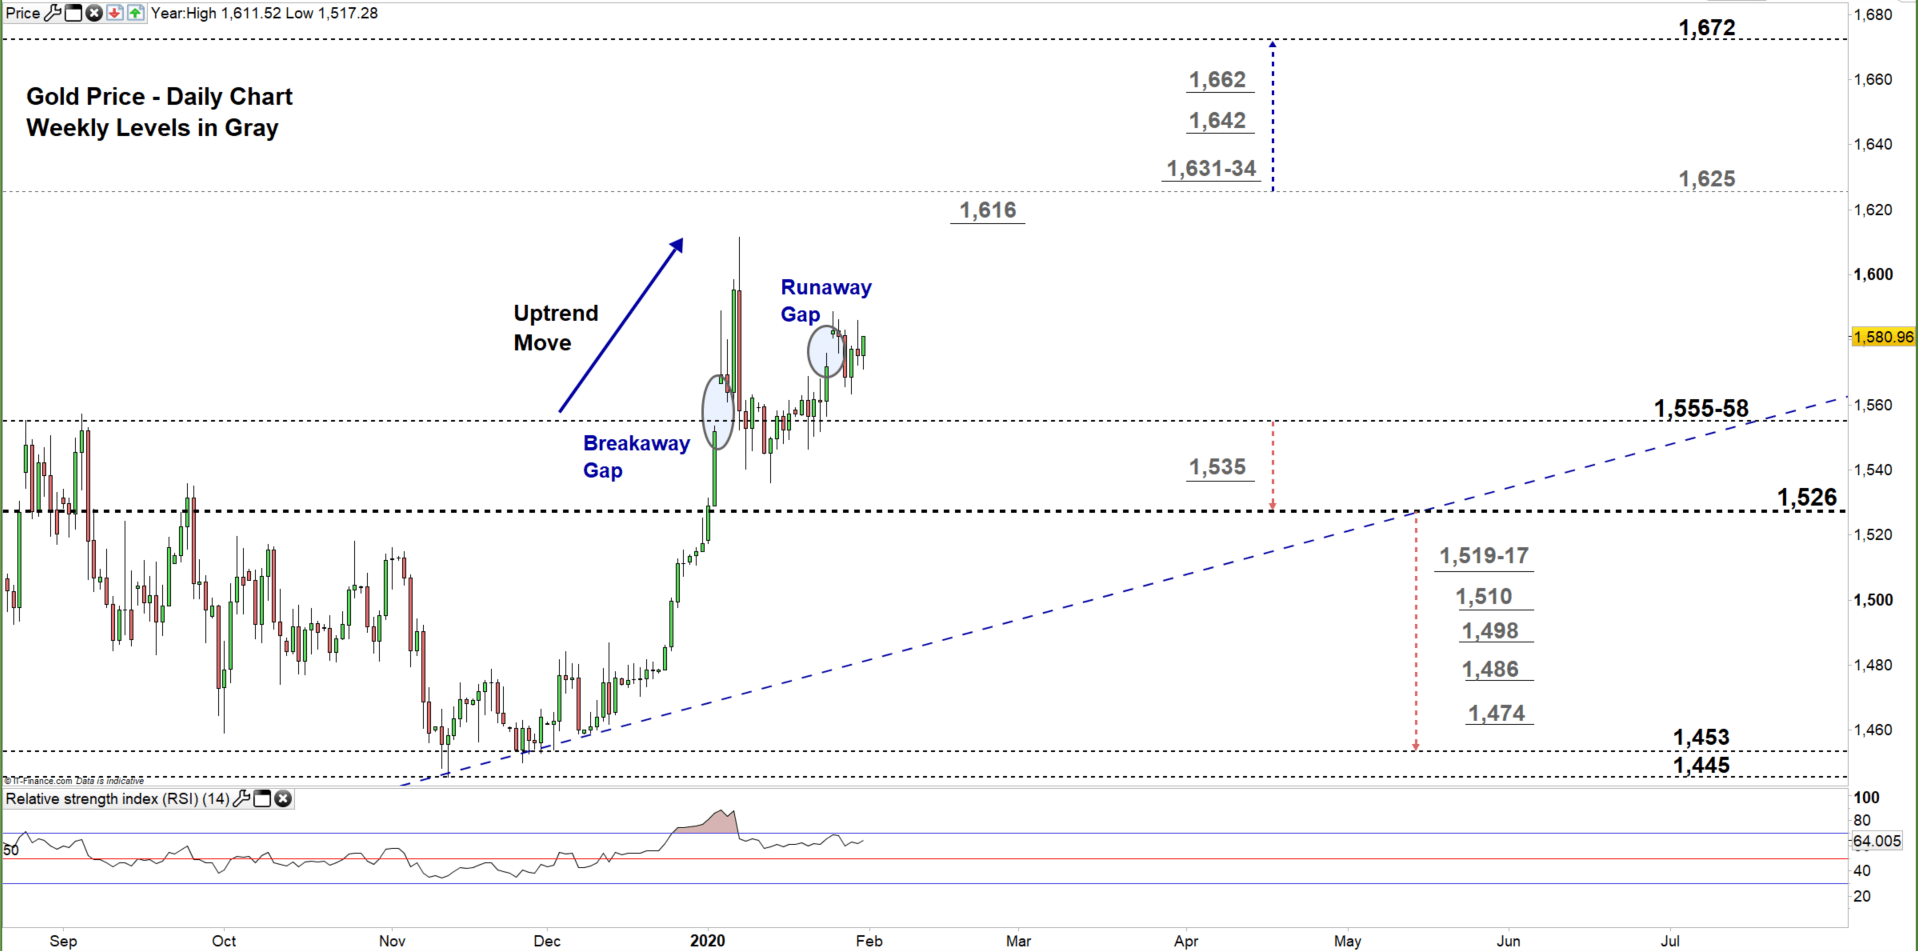
Looking at the daily chart, we notice on Jan 5 Gold opened with a breakaway gap to the upside providing a bullish signal. On Jan 8, the Gold bulls led the price to its highest level in nearly seven years then some seemed to cut back.
On Jan 20, bulls came back and rallied XAU/USD to a higher trading zone $1,555- $1,625 eyeing a test of the high end of it. This week, the market opened with an upward gap ( runaway gap) generating another bullish signal.
A close above the high end of the zone could encourage XAUUSD bulls to push towards $1,672. In that scenario, the weekly resistance levels underlined on the chart should be monitored as some traders may join/exit around theses points.
In turn, a close below the low end of the zone could lead some bulls to exit the market. This may send the price towards $1,526. Further close below this level reflects more bull’s hesitation and possibly opens the door for bears to take charge and press towards $1,453. Nevertheless, the weekly support levels underscored on the chart should be watched along the way.

Gold Four-HOUR PRICE CHART (DEC 30 – Jan 31,2020)
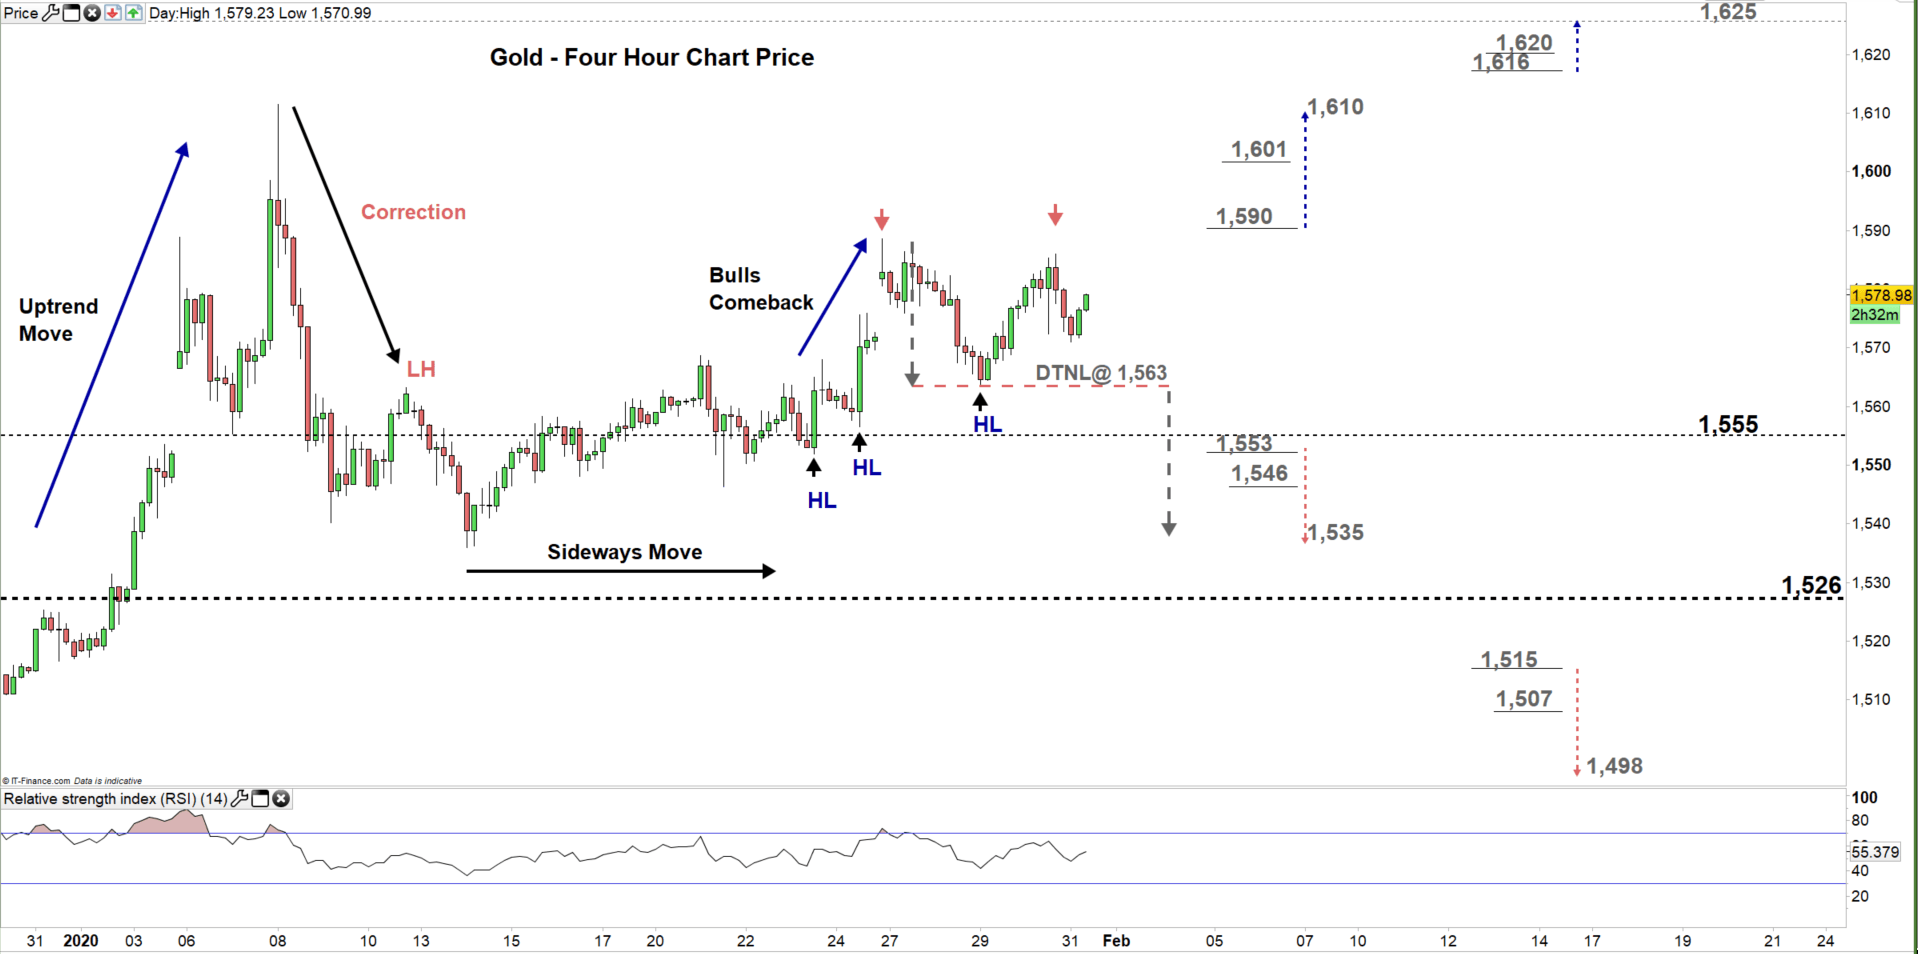
From the four-hour chart, we noticed that on Jan 23 Gold resumed bullish price action and created a higher low with a higher high. Yesterday, the market paused its upward move and started developed a double top pattern. Any violation to the neckline of this pattern located at $1,563 could kick start a downtrend move.
A break below $1,553 may send the price towards $1,535. Yet, the weekly support level underlined on the chart should be kept in focus. On the other hand, a break above $1,590 could cause a rally towards $1,610. Although, the weekly resistance level underlined on the chart would be worth monitoring.
See the chart to know more about key levels Gold would encounter in a further bearish scenario.
Written By: Mahmoud Alkudsi
Please feel free to contact me on Twitter: @Malkudsi


