


Gold Price Forecast
- Gold chart and analysis.
- Gold ’s price action.
Check our latest forecasts for EUR, USD, Oil and find out for free what might move the price this quarter.
Gold Price – Weaker Bullish Momentum
Last week Gold closed in the red for the first time in four weeks. On Friday, the weekly candlestick closed with 0.4% loss.
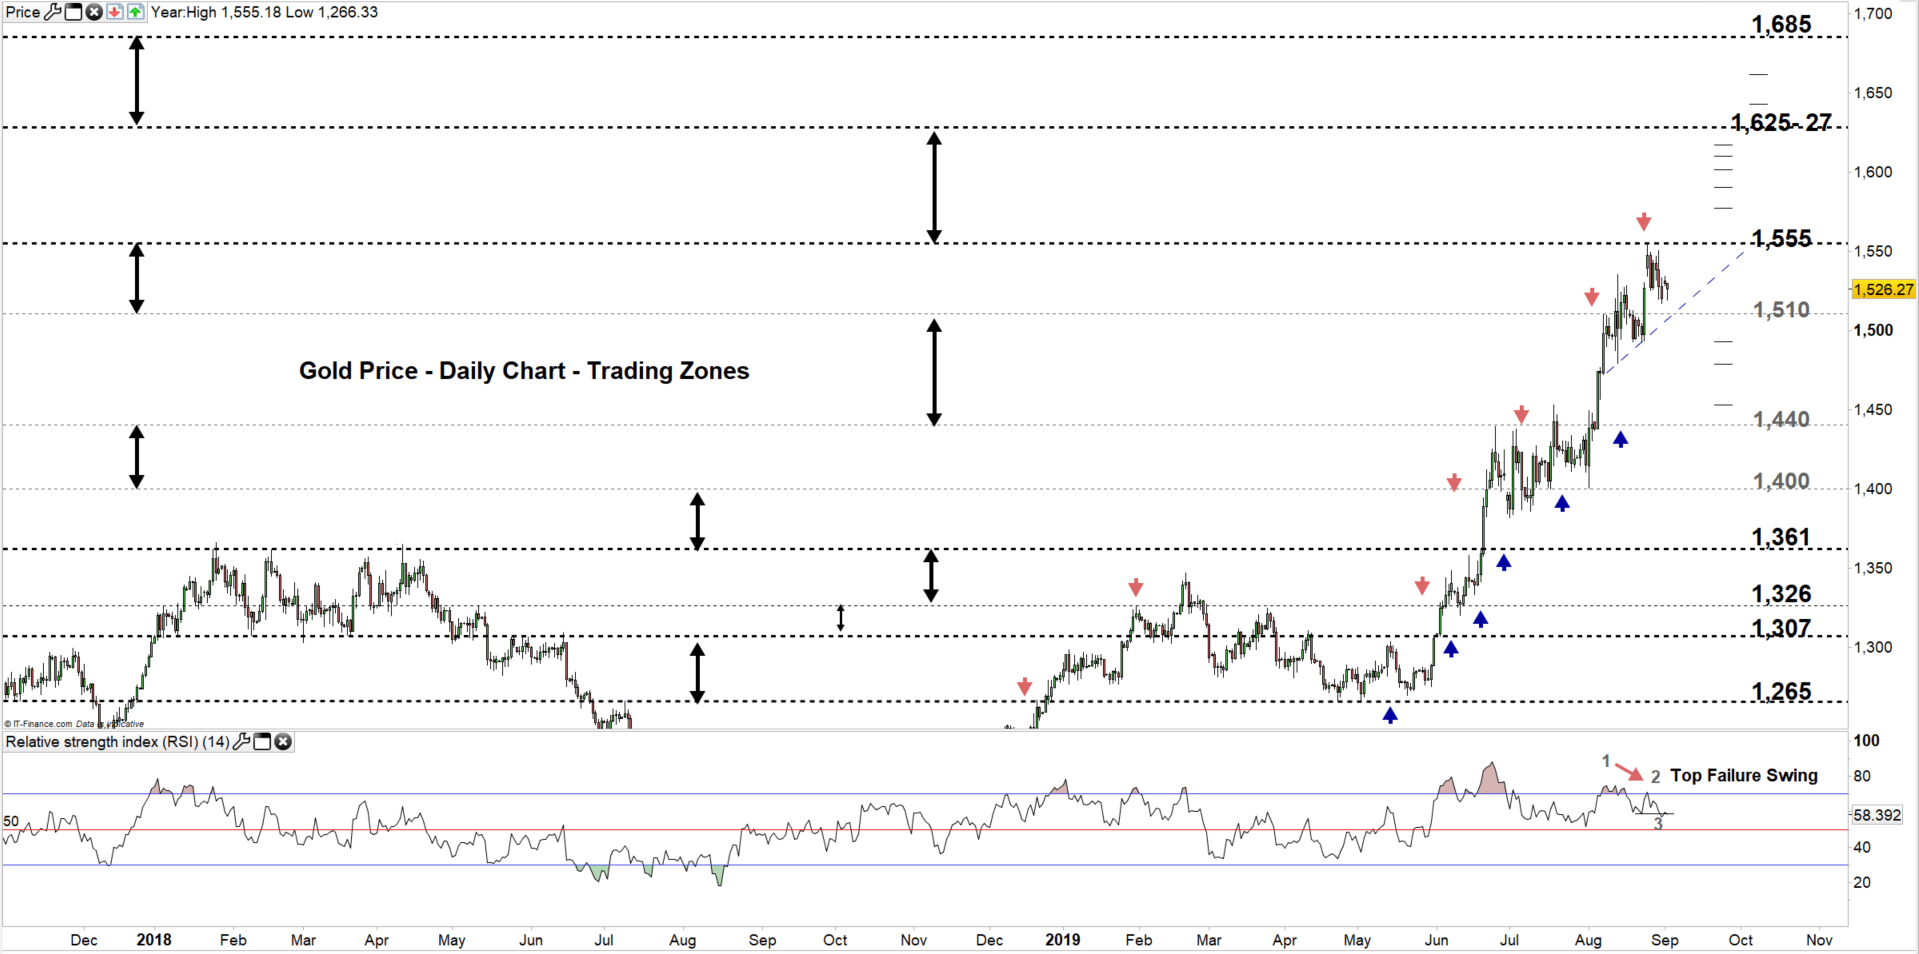
It’s worth noting that a top failure swing occurred after the Relative Strength Index (RSI) peaked in mid-August above 70 then in August 25 failed to exceed previous peak. Few days later the oscillator broke below previous trough indicating to uptrend loss of momentum.
Having trouble with your trading strategy? Here’s the #1 Mistake That Traders Make
Gold DAILY PRICE CHART (Nov 19, 2017 – Sep 2, 2019) Zoomed out
Gold DAILY PRICE CHART (20 June – Sep 2, 2019) Zoomed In
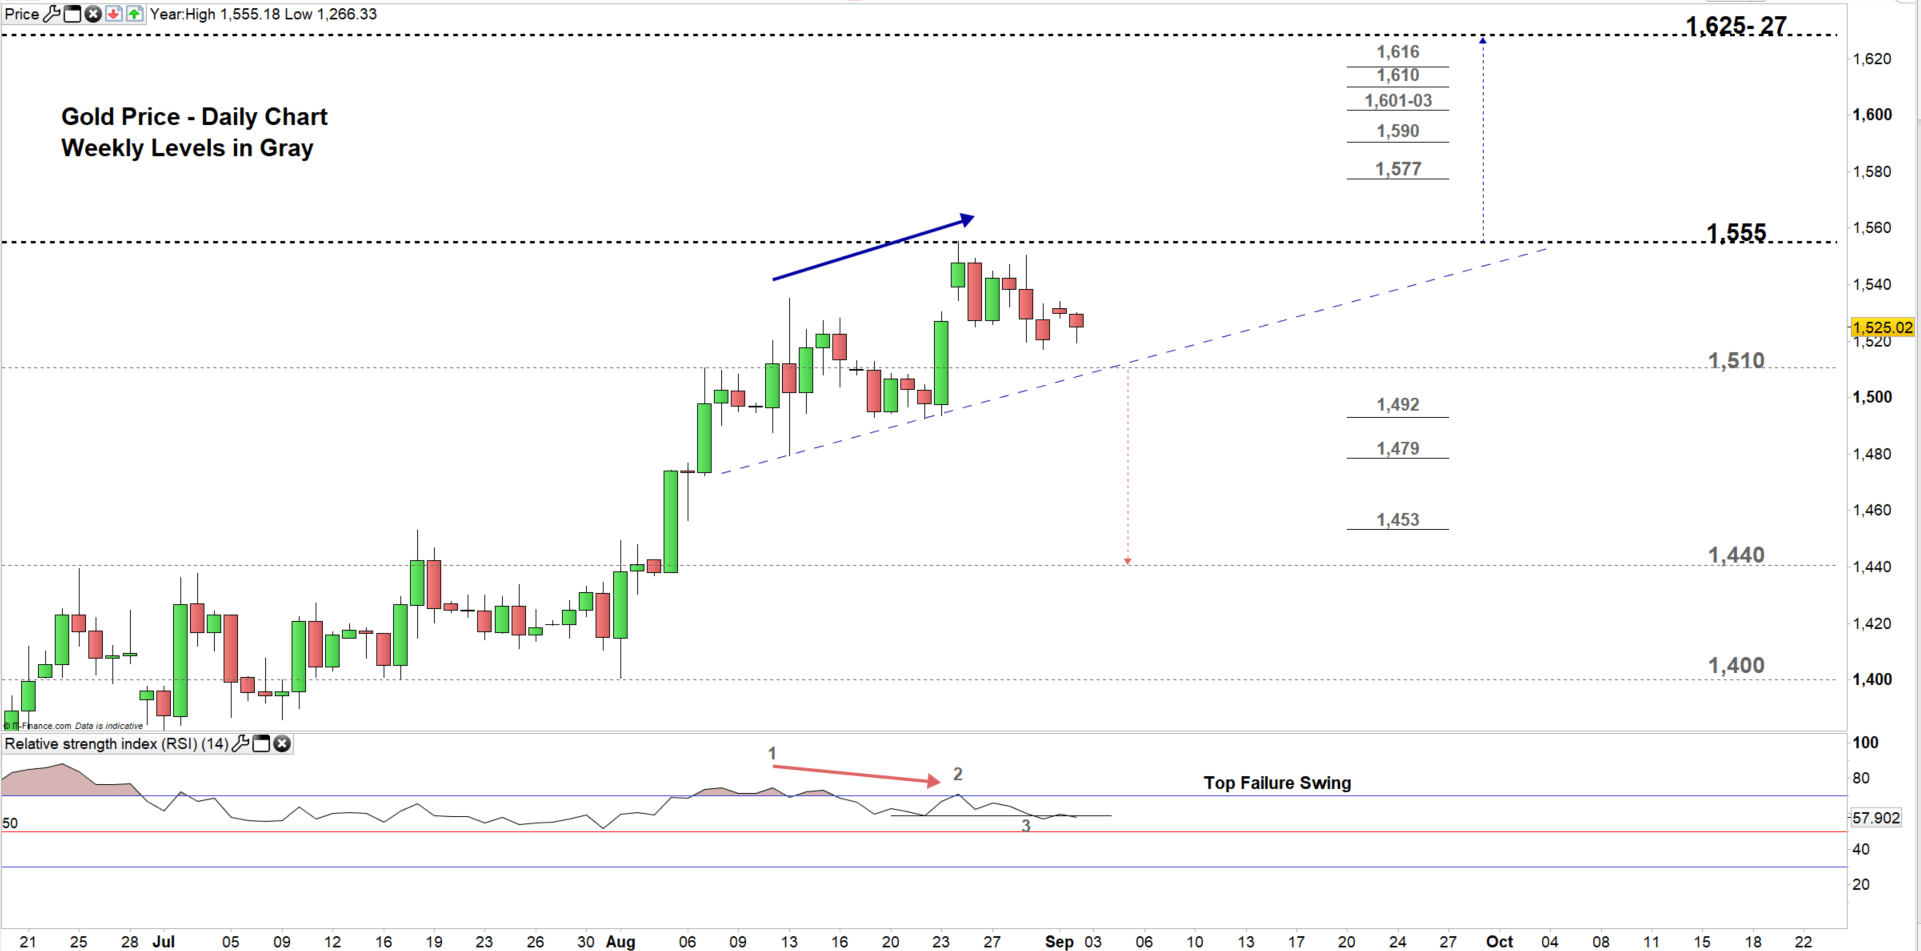
Looking at the daily chart, we notice on August 25 Gold opened with a gap to the upside. However, the precious metal rebounded from the high end of current trading zone $1,510 - $1,555 then reversed course eyeing a test of the low end of the zone.
Thus, a close below the low end could press XAU/USD towards $1,440. Although, the weekly support levels underlined on the chart (zoomed in) should be considered.
On the other hand, any failure in closing below the low end of the zone may send XAU/USD back towards the high end of the zone. Further close above the high end could resume bullish price action towards the vicinity of $1,625-27. Nonetheless, the weekly resistance area and levels marked on the chart need to be followed closely.
Just getting started? See our Beginners’ Guide for FX traders
Gold Four-HOUR PRICE CHART (JuLY 10 – Sep 2, 2019)
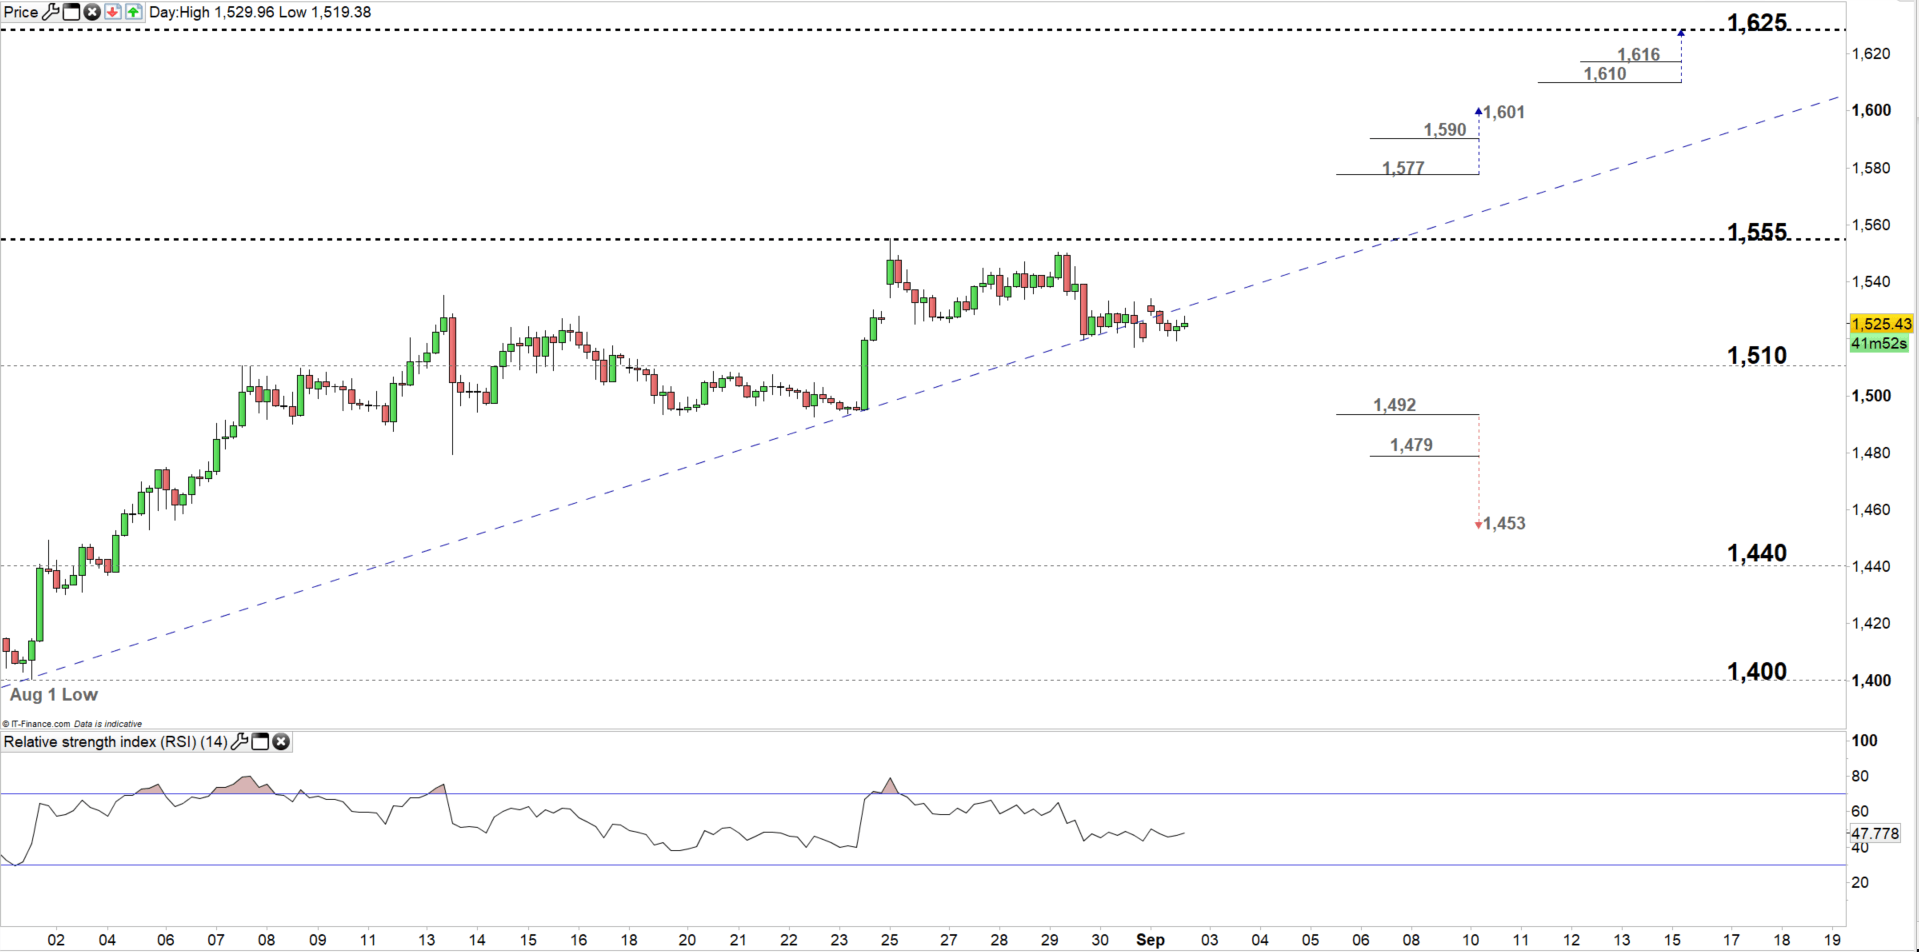
From the four-hour chart, we notice on August 1 Gold started uptrend move creating higher highs with higher lows. However, on August 30 the market corrected lower creating a lower low at $1,517.
Hence, a break below $1,492 could mean more bearishness towards $1,453. That said, sellers need to consider the weekly support level underlined on the chart.
On the other hand, a break above $1,577 could revisit uptrend move towards $1,601. With that scenario weekly resistance levels underscored on the chart would be worth monitoring.
Written By: Mahmoud Alkudsi
Please feel free to contact me on Twitter: @Malkudsi


