


Gold Price & Silver Technical Highlights:
- Gold price breakout holding so far
- Wedge formation developing on 4-hr chart
- Silver still capped by falling wedge t-line
See what intermediate-term fundamental drivers and technical signposts our team of analysts are watching in the DailyFX Q2 Gold Forecast.
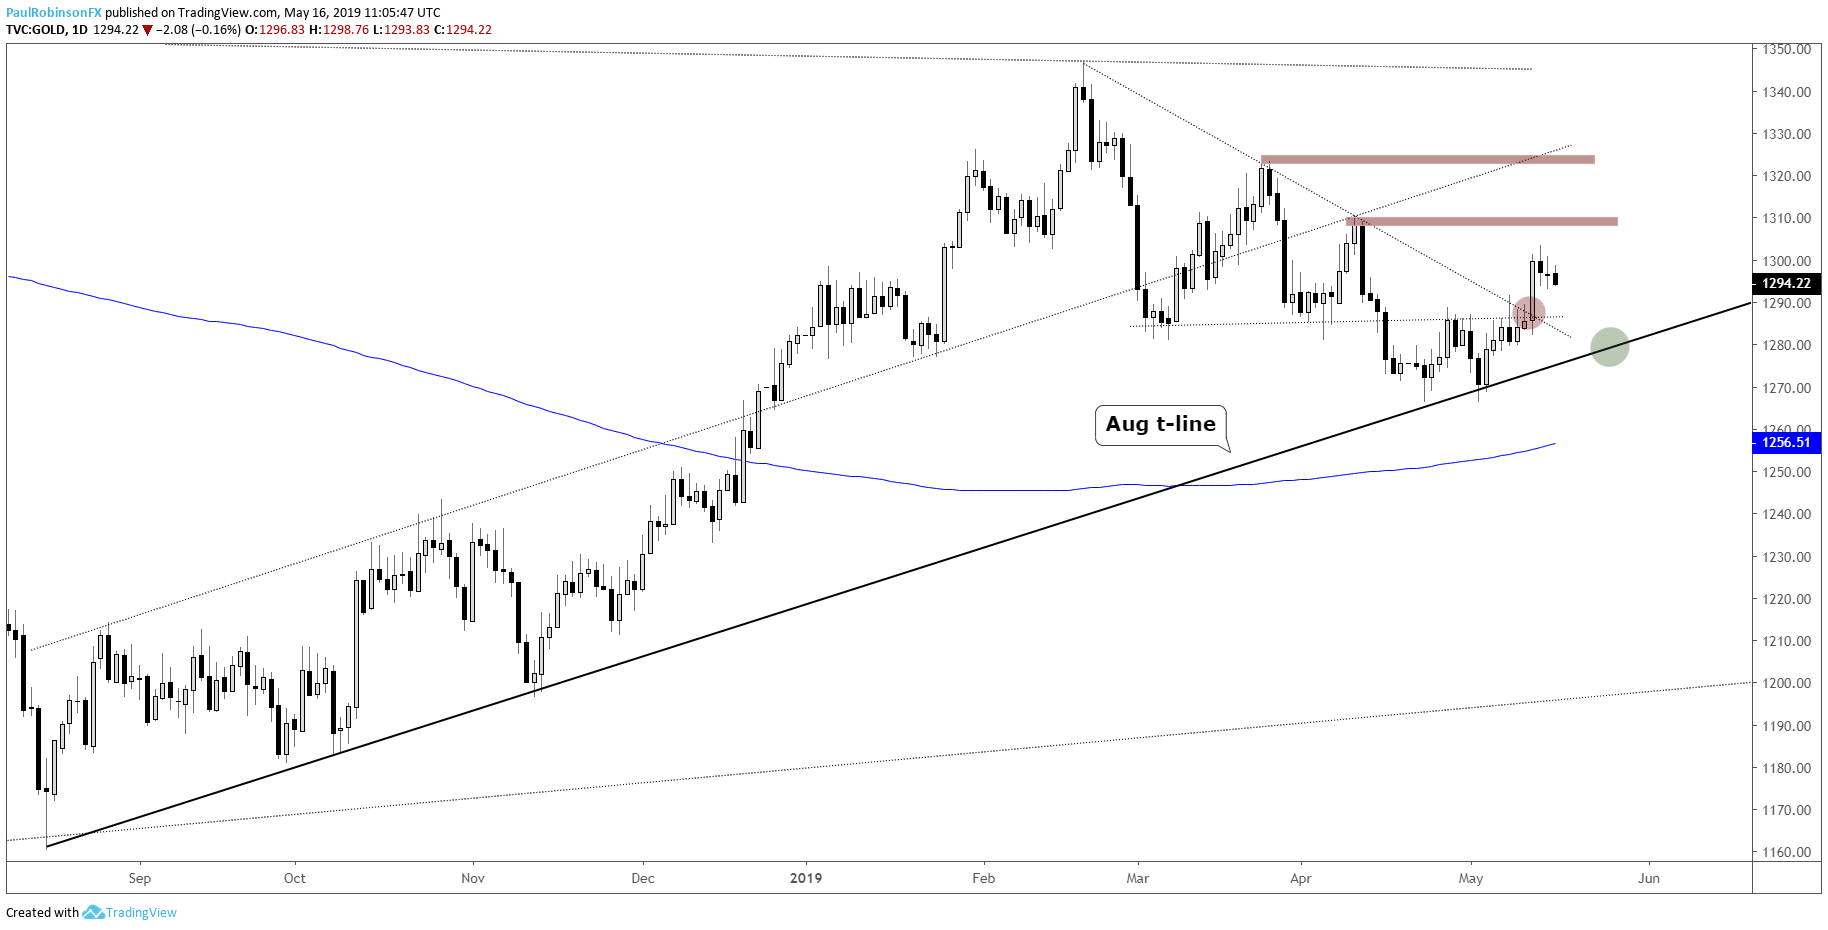
Gold price breakout holding so far
On Monday, gold price broke above a confluence of resistance lines running down from February and over from March, a pair of lines that made up a descending wedge pattern that has been negated. The breakout was convincing and so thus far holding up with relatively well.
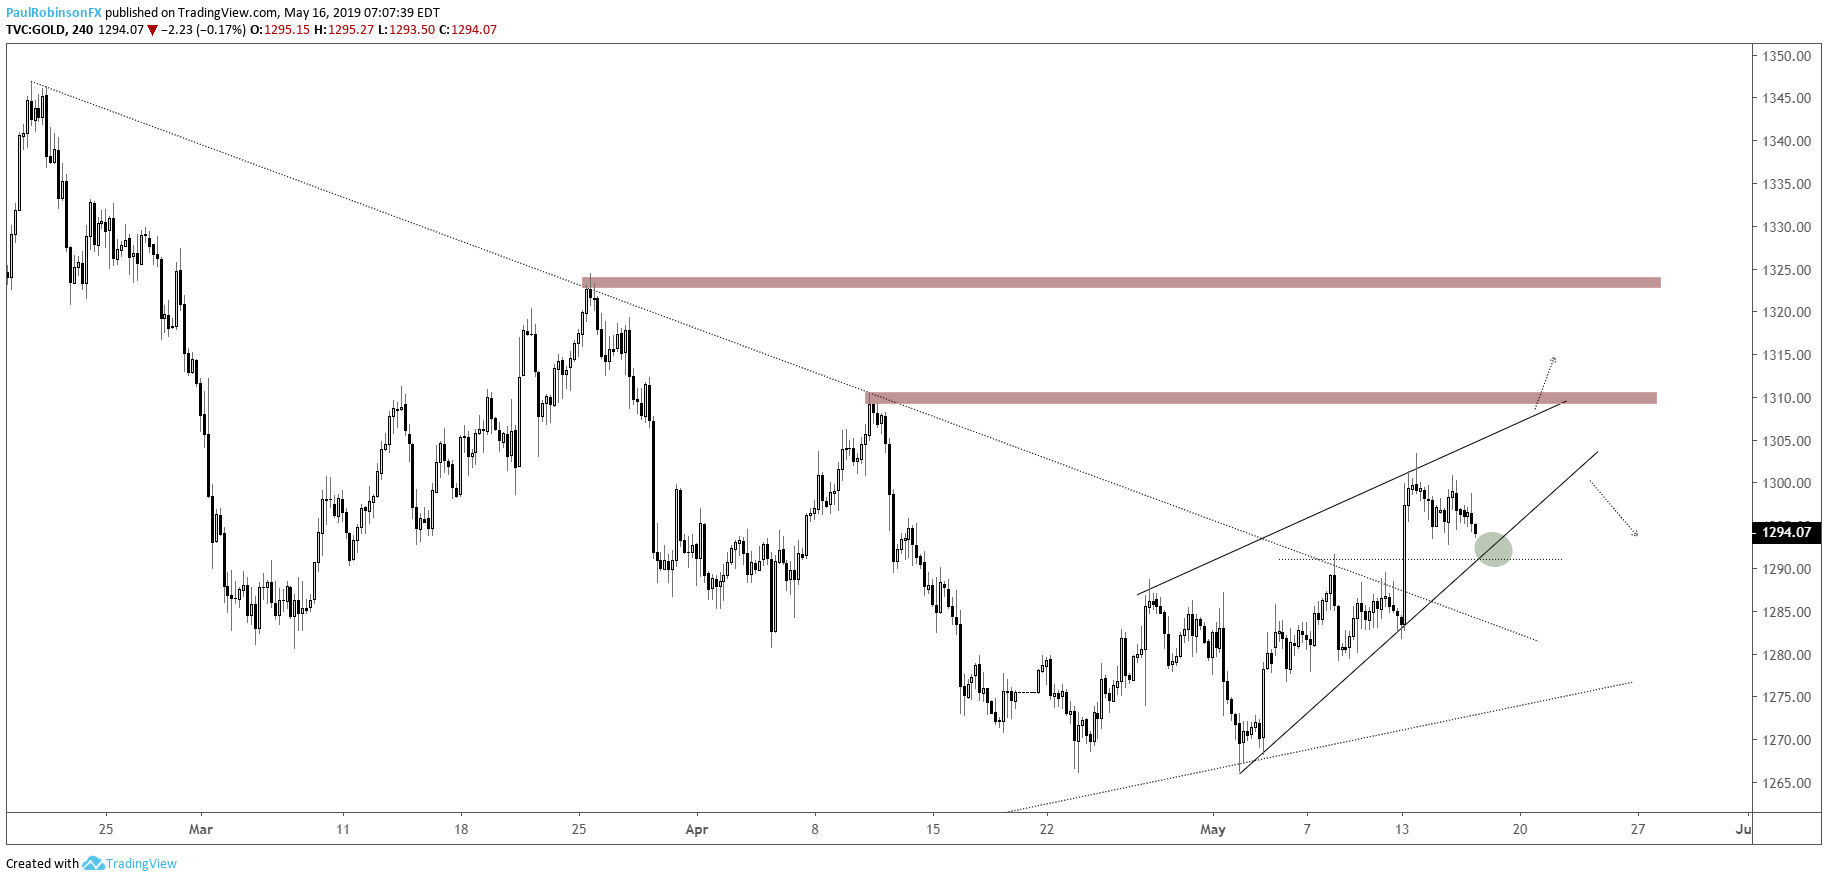
The breakout and subsequent price action is setting gold up for another possible leg higher towards resistance around the 1308/1310-mark. There is, however, a wedge developing which could either turn out to propel gold higher or mark the end of the up-move and set into motion a decline.
If the rising wedge is to come to fruition it is preferred that it fills out a bit more, which means at least another touch of the underside trend-line before chalking this up as a clean formation. Stay above the underside line and the bias remains tilted upward, with a breakout above the top-side line leading to the aforementioned 1308/10 area and possibly an even bigger breakout.
An eventual undercutting of the bottom-side of the pattern will be a bearish event that would likely lead to a move back towards the August trend-line (~1280) which was held twice over the past three weeks.
Check out the IG Client Sentiment page to see how changes in trader positioning can help signal the next price move in gold and other major markets and currencies.
Gold Price Daily Chart (will the break higher sustain?)
Gold Price 4-hr Chart (wedge forming)
Silver still capped by falling wedge t-line
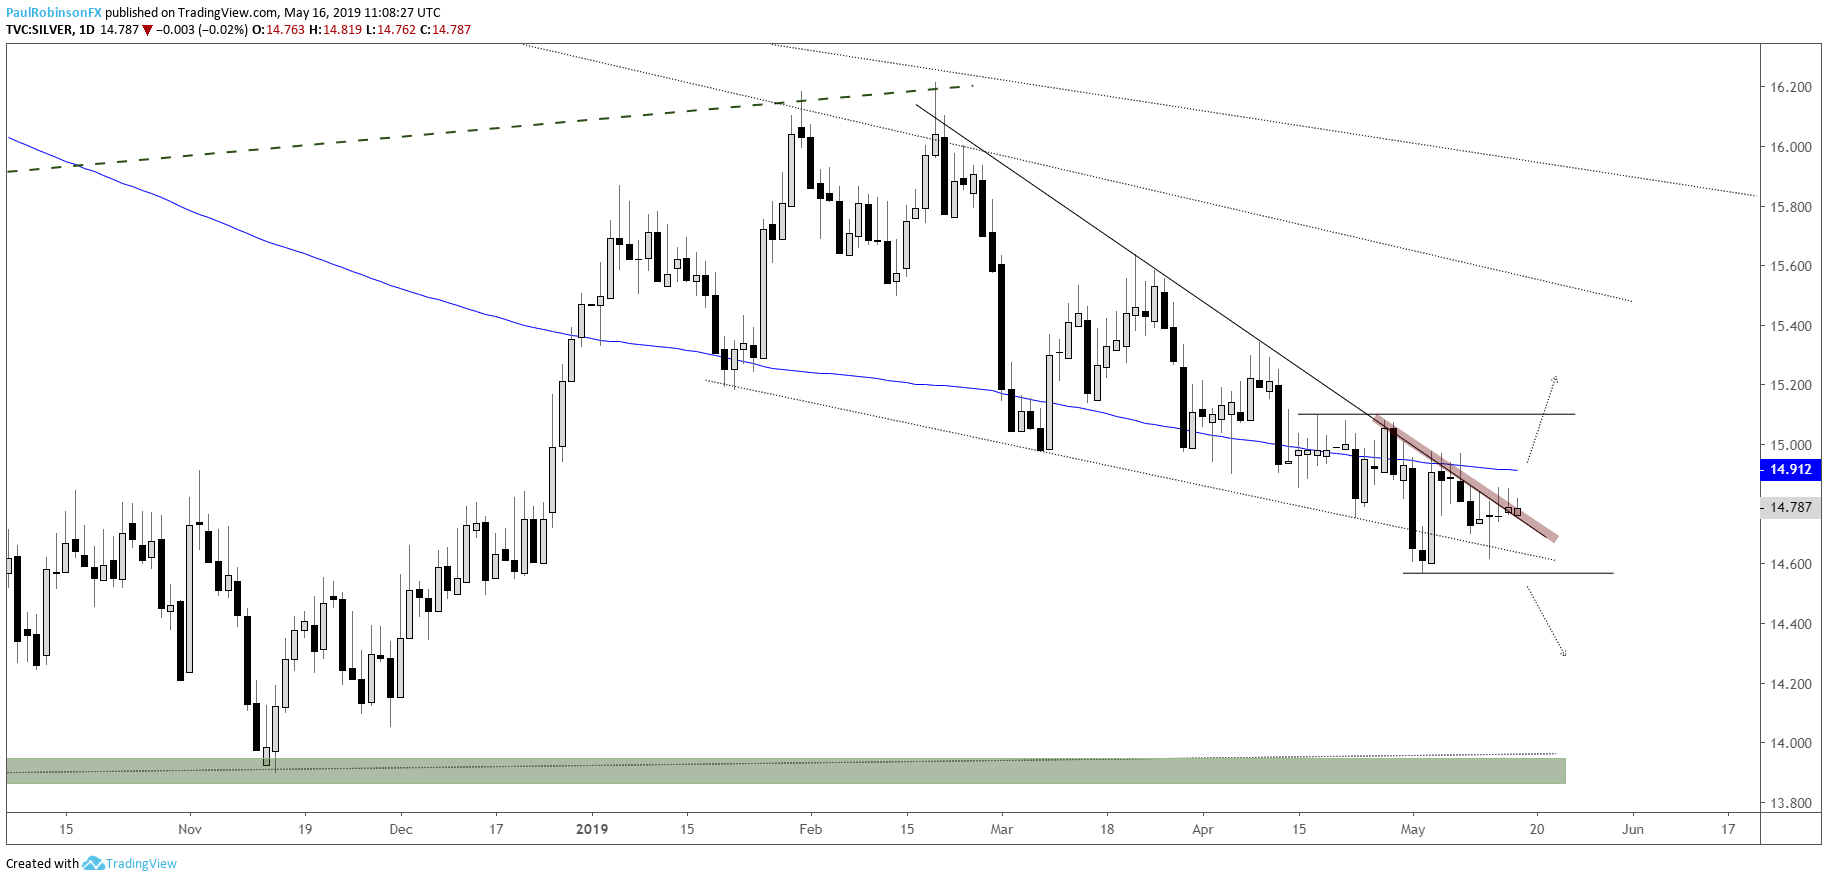
The trend-line dating back to the February high continues to be an impressive source of resistance for silver as it keeps the precious metal edging lower. This line makes up the top-side of a sizable falling wedge. We saw a false breakdown to start the month which was quickly taken back; could the fake-out breakdown turn into an upside breakout?
A convincing break of the top-side trend-line of the pattern and move above the 200-day into the 15s may do the trick. Continued failure to rise above the trend-line may eventually lead sellers to gaining full control and a break of May 2 low at 14.56; with the 14-area initially targeted in this outcome. Either way, the pattern has a lot of pent up pressure, so a big move could soon be in store.
Silver Daily Chart (t-line acting as strong resistance)
Resources for Forex & CFD Traders
Whether you are a new or experienced trader, we have several resources available to help you; indicator for tracking trader sentiment, quarterly trading forecasts, analytical and educational webinars held daily, trading guides to help you improve trading performance, and one specifically for those who are new to forex.
---Written by Paul Robinson, Market Analyst
You can follow Paul on Twitter at @PaulRobinsonFX


