Crude Oil Technical Highlights:
- Oil crossed over, back under top-side trend-line of pattern
- This week’s slide seen as likely to continue in the near-term


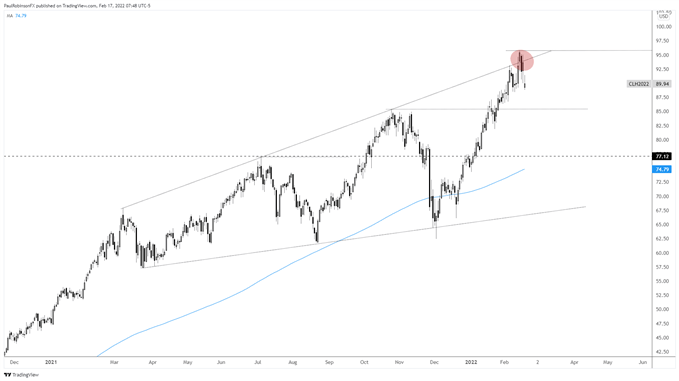
Since the December low WTI crude oil had risen roughly 50%, with it clearly entering overbought territory. Geopolitical threats have helped keep a bid in place, though in the past week the level of volatility has risen significantly from day to day.
This type of behavior after such a large run is indicative of some type of inflection point forming. Especially when the volatility arises around a technical threshold. On Monday, CL closed above the top-side trend-line of a wedge dating to March of last year. This lasted only one day and is now considered a small overthrow, a common event around important levels.
Whether the recent price action and run-in with the top-side trend-line leads to a large decline or something more benign, in the short-run it does appear likely that we see more weakness before crude firms up.
The first level of meaning to watch on the downside arrives at the October peak at 85.41. We will want to pay close attention to how price action behaves should we see that level. A thrust off support may indicate the correction is over, while a garnering of more momentum on a break of support could usher in a much larger decline, perhaps even towards the rising 200-day MA.
If we see crude hang around current levels and post a consolidation pattern, it will be interesting to see if it can lead to oil escaping the gravity of the expanding wedge. The recent turn down now makes four connecting points, so the top-side trend-line continues to become an increasingly important line to watch.
For now, I think the bias is towards the downside, but traders will need to tread carefully in this headline driven market. For those wanting to avoid potential headline risk, sitting this one out until the dust settles may be a prudent move.


Crude Oil (CL1!) Daily Chart

WTI Crude Oil Chart by TradingView
Resources for Forex Traders
Whether you are a new or experienced trader, we have several resources available to help you; indicator for tracking trader sentiment, quarterly trading forecasts, analytical and educational webinars held daily, trading guides to help you improve trading performance, and one specifically for those who are new to forex.
---Written by Paul Robinson, Market Analyst
You can follow Paul on Twitter at @PaulRobinsonFX


