


To receive Tyler’s analysis directly via email, please SIGN UP HERE
Crude Oil Price Forecast Talking Points:
- WTI Crude Oil Technical Analysis Strategy: strong impulsive rise could take price to $70/bbl
- Weaker dollar is helping to boost overall commodity demand as hedge funds load up
- Trader Sentiment Highlight from IG UK: Rise in net-long positions may favor ST dip
The trend in Crude Oil has been in a word, unstoppable. There remain a lot of supporting factors that traders continue to watch in amazement as they build to support the rising price of Crude Oil further.
Hedge Funds Continue to Pile In To WTI & Brent Long Positions
The CFTC’s Commitment of Traders report showed that hedge funds are set to push and look to profit on marginal gains in Crude Oil as prices look set to approach $70/bbl in the current move. Data as of January 23rd showed a record Brent long net position of 584,707 contracts.
The recent fundamental backing of added institutional positioning is two-fold. First, traders continue to find encouragement in the compliance and long-term commitment that OPEC members are pledging to the deal. Recently, Iraq showed commitment when their acting director of the state-run oil company, Alaa Alyasri said that Iraq is committed to the OPEC output cuts deal and rumors are abounding that the agreement could make its way into 2019, which would help to eradicate the global oil supply glut.
Second, the drop in U.S. stockpiles is continuing to be drawn, even as refiners pull-back their purchasing of Crude as the fervor they showed in H2 2017. US stockpiles drawdowns are in the midst of their longest consecutive drawdowns on record, and the weak US Dollar is only adding to the support for higher commodity prices.
A lot of this positive sentiment is built into the futures curve, which is pricing in a premium for products closer to delivery. When the front-month holds a premium to the later-dated futures contracts, backwardation forms. Backwardation helps to give a boost to the contract most commonly traded as demand rises and supplies tighten.
Technical Levels for WTI Crude Oil
When markets are rallying as Crude Oil has been, traders do well to ask themselves two questions. First, what’s a legitimate profit target that we may expect traders to begin taking profits? A profit target, of course, is not the same as a sell signal or reversal point.
The second question is to ponder at what level the Bullish momentum would stall, and the outlook would go from Bullish to Neutral. The zone of price support that should keep traders looking higher if price fails to close above is the $62.45/75 zone, which marks the zone between the 2015 high and the pullback low on January 19.
Should price break and close below this zone, traders should start to look for a broader pullback, given the overextended bullish positioning that may close out their long trades at the November high of $59/bbl.
A hold above the $62.45/75 zone would favor keeping sights on the 100% extension of the initial move off the 2016 low from the June 2017 low at $70.01.
Unlock our Q1 18 forecast to learn what will drive trends for Crude Oil at the open of 2018.
Crude Oil Chart Watch: Moving Toward $70/bbl
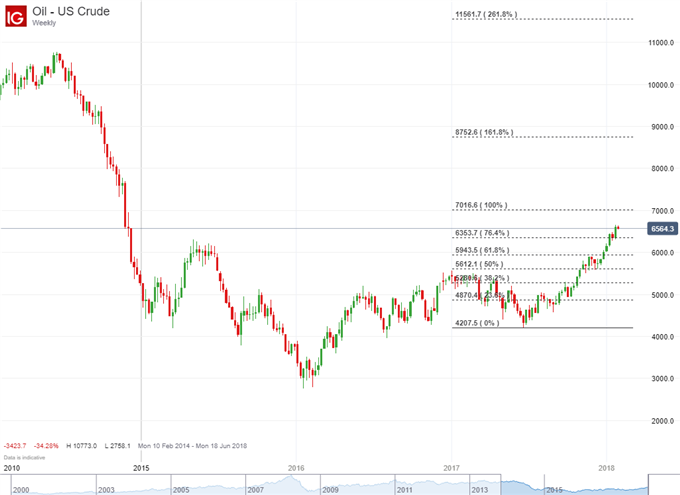
Chart created by Tyler Yell, CMT. Tweet @ForexYell for comments, questions
WTI Crude Oil Insight from IG Client Positioning
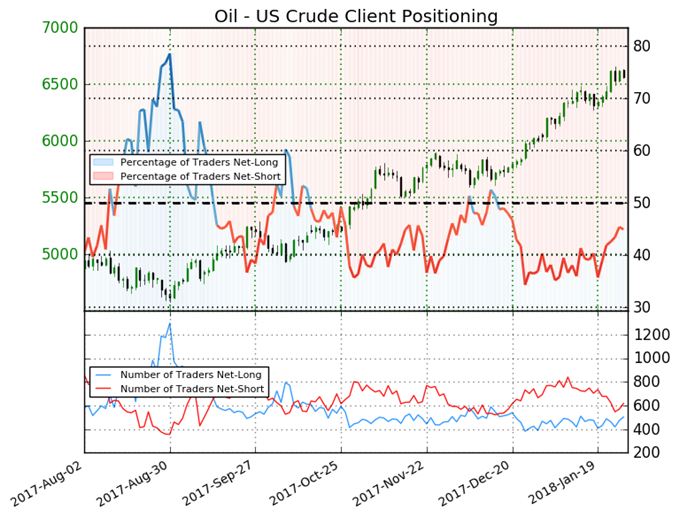
We typically take a contrarian view to crowd sentiment, and the fact traders are net-short suggests Oil - US Crude prices may continue to rise. Positioning is more net-short than yesterday but less net-short from last week. The combination of current sentiment and recent changes gives us a further mixed Oil - US Crude trading bias.
---
Written by Tyler Yell, CMT, Currency Analyst & Trading Instructor for DailyFX.com
To receive Tyler's analysis directly via email, please SIGN UP HERE
Contact and discuss markets with Tyler on Twitter: @ForexYell


