


Key Takeaways:
- Crude Oil technical strategy: Switching bias from neutral to bullish, buying dips
- Brent (global oil benchmark) trades to highest price since July 2015
- RSI(5) on US Oil at highest level of 2017, showing momentum breakout
Happy days have arrived for the long-suffering Bulls of Crude Oil. Multiple Bullish signs are being confirmed with Monday’s price action on both the global benchmark, Brent Oil, and the American Oil Index, WTI Crude Oil. The technical ‘golden cross’ pattern is the most recent sign that good times are here for a while in the oil market as the 50-day moving average has traded above the 200-day moving average for the first time since 2016.
Long-term trend traders will look to a 50-day moving average cross above a 200-day moving average cross as a long-term sign of a Bullish market. While the event of the crossover of two long-term moving averages is exciting, entering at the time of the cross-over can lead you to enter at a temporarily extended price. The temporary extensionis also evidencedby the RSI(5), a momentum indicator, currently at its highest level of the year.
However, traders can look for pull-backs as opportune moments to buy a market that is working in a longer-term uptrend that corrects lower without disrupting the overall uptrend. Traders are likely keeping an eye on the spread between WTI and Brent Crude, which is trading at its widest spread since August 2015 at over $6 per barrel. There have been concerns that WTI is being influenced negatively by US E&P whereas Brent is benefitting from the global demand pickup alongside the pullback in OPEC production.
Traders watching WTI Crude would do well to keep an eye to see if a pull-back in price is temporary as proven by holding above the $50/bbl mark. If $50/bbl becomes a new support level, we could see a rush of buyers enter back into the market. Earlier in the year, funds were excited about the prospects of an Oil recovery, but then they exited on failed attempts of the energy commodity to break out. It may be that they were right, just early. If so, they have the logic figured out, and they could turn flow into the energy market to see a new Bull trend establish itself.
As global oil demand forecasts shift higher, check out our free forecast on Crude Oil prices
Daily US Oil Chart: Breakout above resistance and sentiment favors approach to resistance
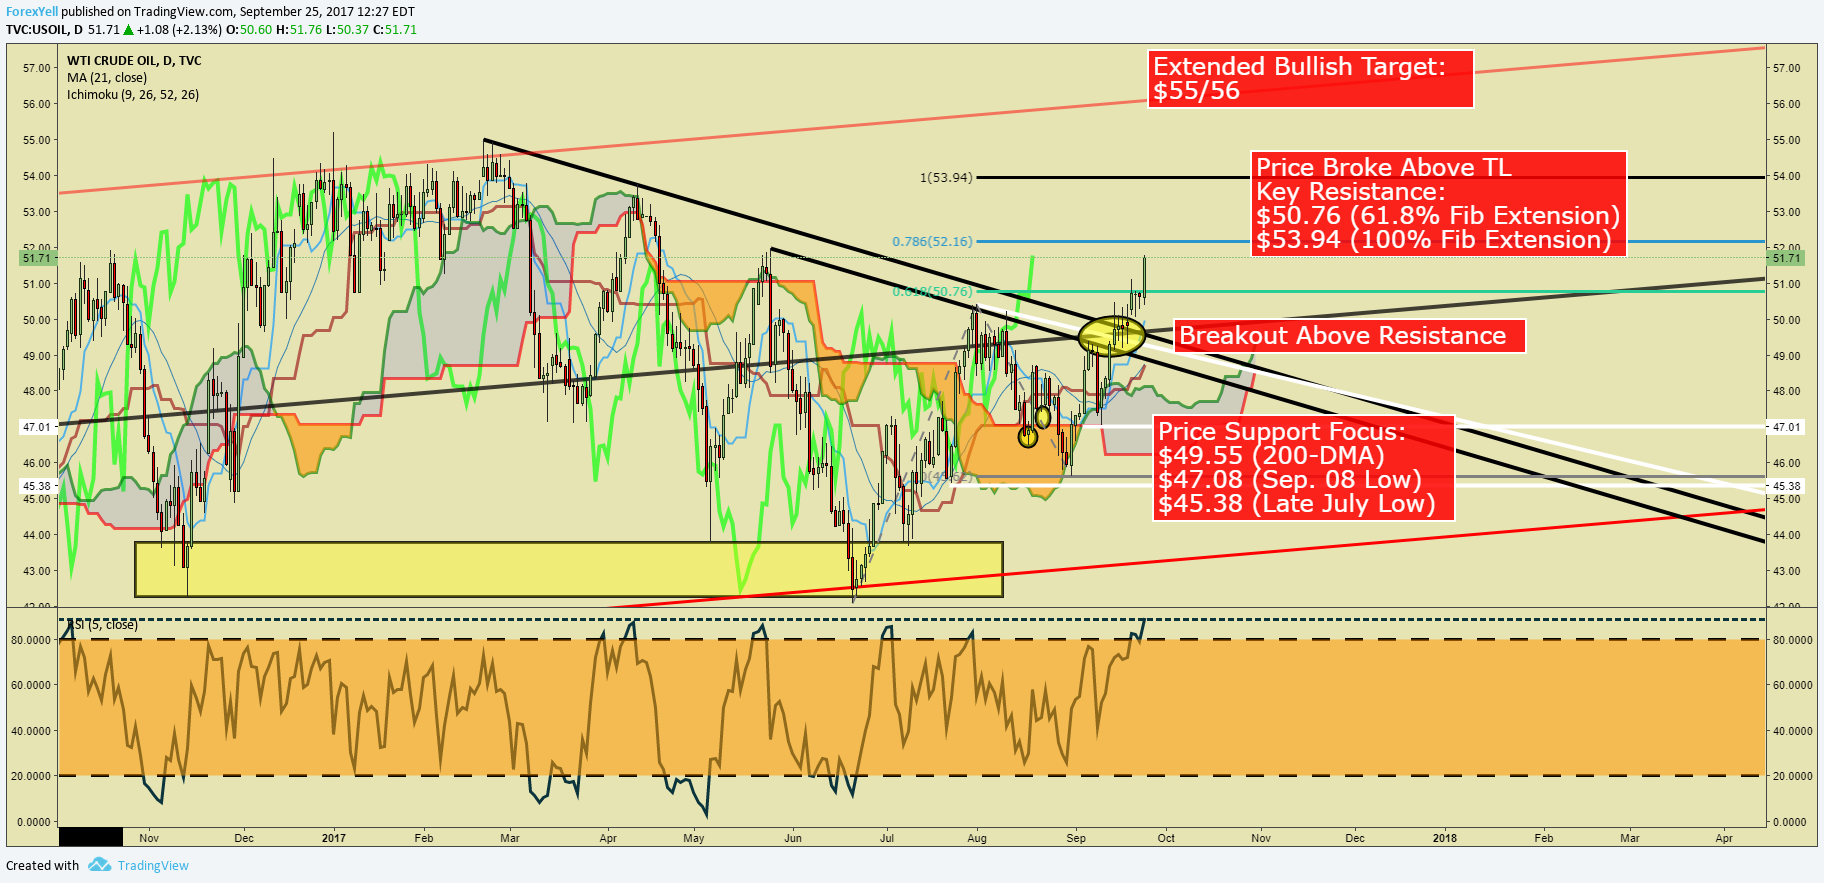
Chart Created by Tyler Yell, CMT
---
Written by Tyler Yell, CMT, Currency Analyst & Trading Instructor for DailyFX.com
To receive Tyler's analysis directly via email, please SIGN UP HERE
Contact and discuss markets with Tyler on Twitter: @ForexYell


