


EUR /JPY and USD/JPY Outlook
- Euro and US Dollar price against Japanese Yen charts and analysis
See Our latest trading guides for free and discover what is likely to move the markets through Q4 of this year.
Weaker Japanese Yen Across the Board
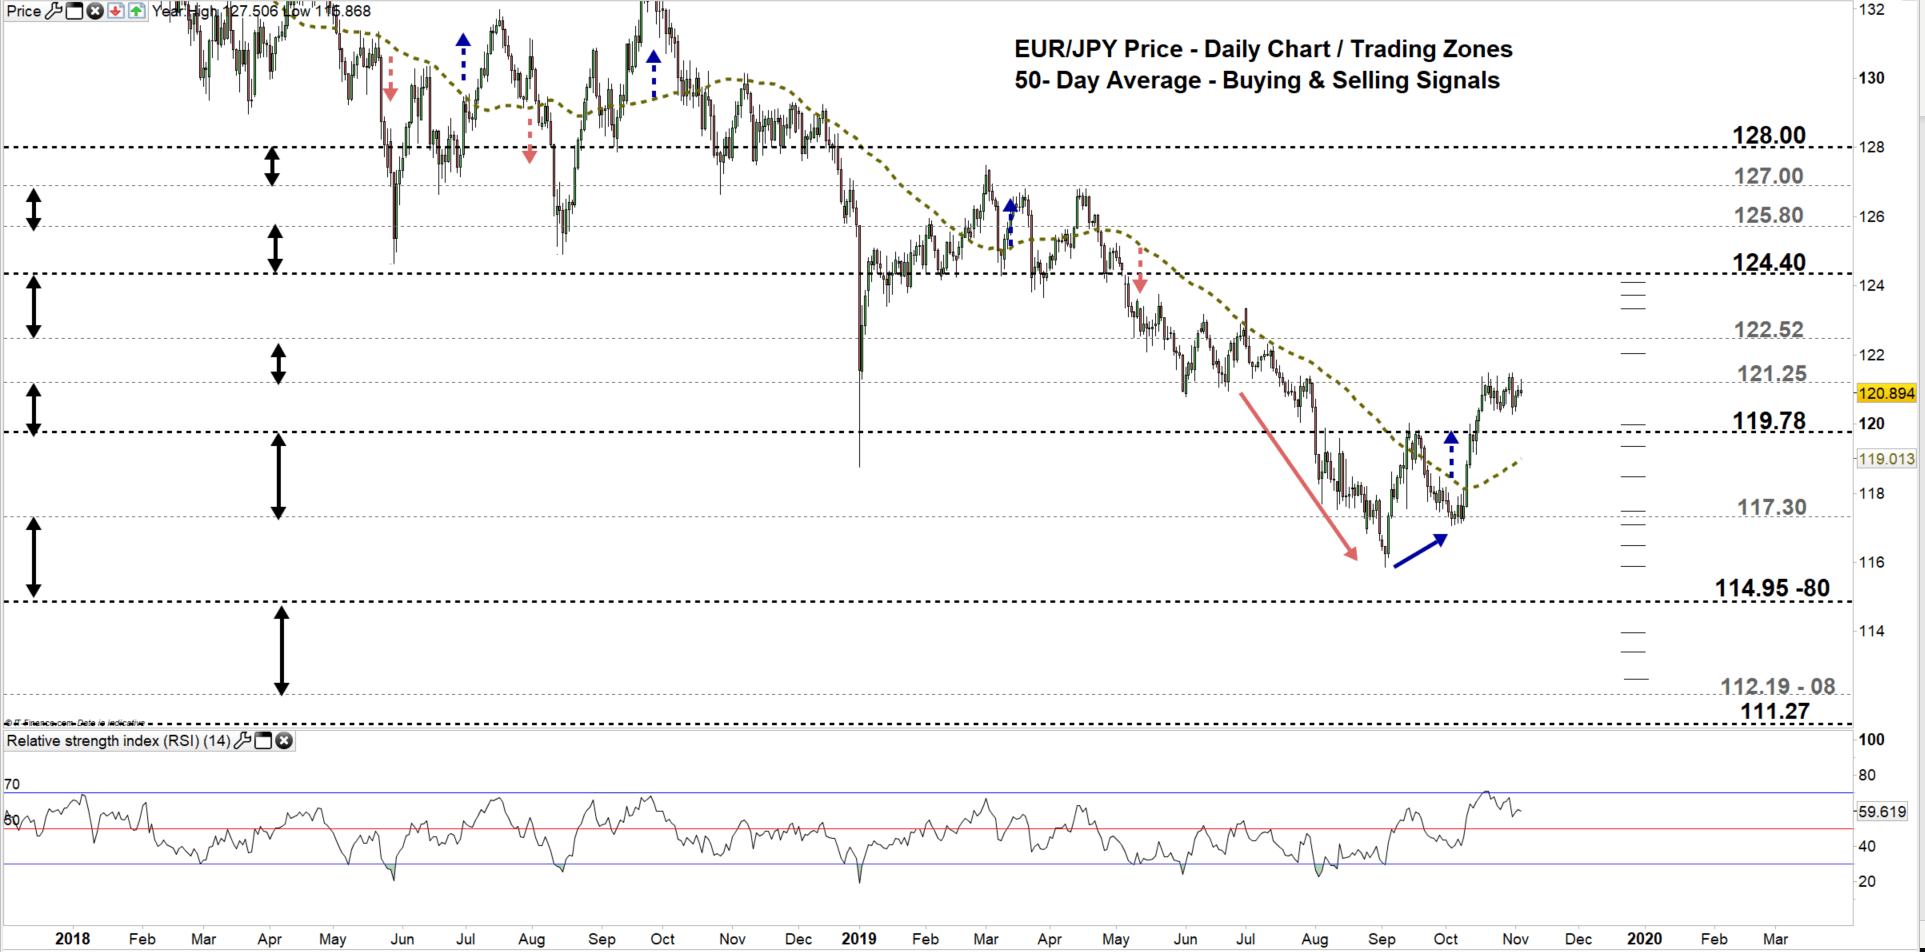
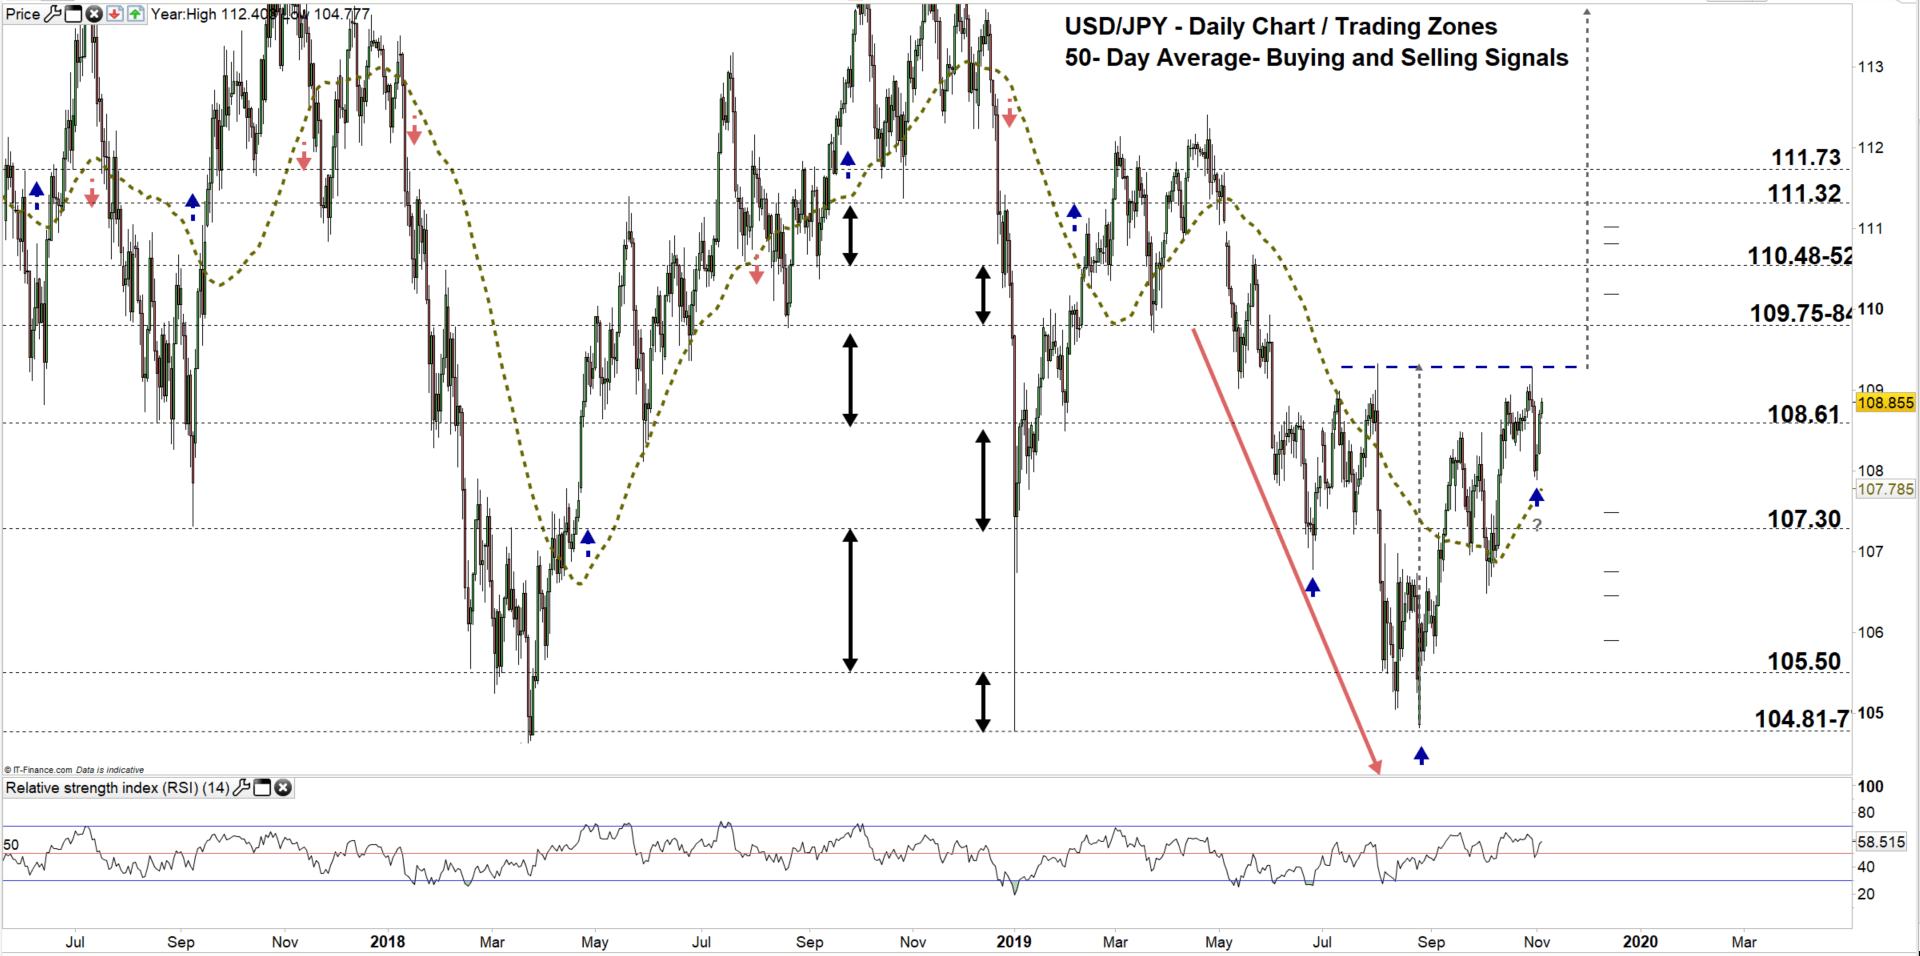
On mid-Oct, Japanese Yen softened against Euro and US Dollar. On Oct 21, EUR/JPY printed 121.47- its highest level in over three months. Since then, uptrend momentum paused indicating to buyer’s indecision. Meanwhile, USD/JPY rallied on Oct 30 to 109.29 – its highest level in nearly two months.
Since Oct 9, the Relative Strength Index (RSI) have remained above 50 on EURJPY highlighting the uptrend move is still intact.
Having trouble with your trading strategy? Need a hand? Here’s the #1 Mistake That Traders Make
EUR/JPY Daily PRice CHART (DEC 20, 2016 – NOv 5, 2019) Zoomed Out
EUR/JPY Daily Price CHART (May 27 – NOV 5, 2019) Zoomed in
Looking at the daily chart, we notice on Friday EUR/JPY U-turned then rallied eyeing a test of the high end of current trading zone 119.78 -121.25. Today, the price has traded above the high end. However, it pulled back to the aforementioned trading zone.
Its worth noting that, if the price breaks and remains below the neckline of double top pattern, this could send EURJPY towards 109.05. In that scenario, any close below the low end of the trading zone might cause more bearishness towards 117.30. Although, the weekly support levels underlined on the chart (zoomed in) should be considered.
On the other hand, any failure in closing below the low end of the zone could see EURJPY trading again towards the high end of the zone. Further close above the high end would increase the likelihood of the price to rally towards 122.52. Although, the weekly resistance levels underscored on the chart would be worth monitoring.
Just getting started? See our Beginners’ Guide for FX traders
USD/JPY Daily PRice CHART (June 11, 2017– Nov 5, 2019) Zoomed Out
USD/JPY Daily PRice CHART (April 30 – Nov 5, 2019) Zoomed In
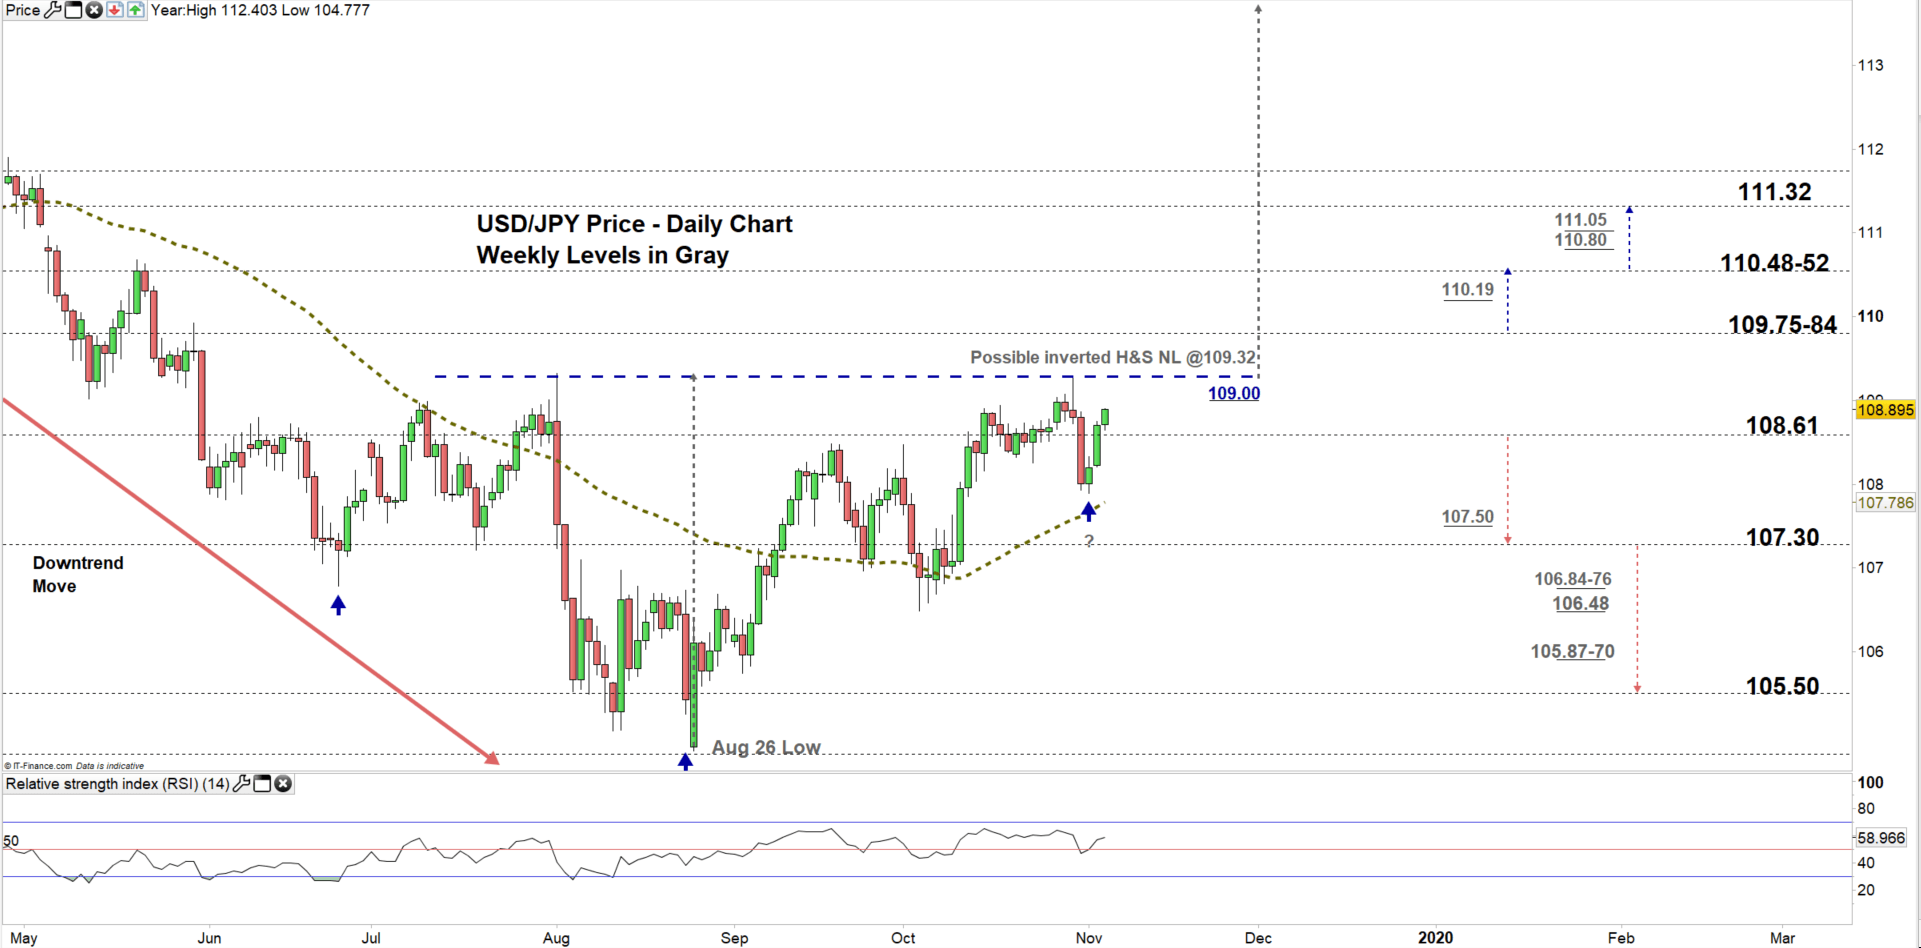
Looking at the daily chart, we notice on Friday USD/JPY U- turned similarly to EUR/JPY. Yesterday, the price rallied to a higher trading zone 108.61 – 109.75 creating the second shoulder of the inverted head and shoulders pattern discussed in our last update.
Thus, the price maybe on its way for a test of the high end of the zone. Further close above 109.84 could see USDJPY trading even higher towards the vicinity of 110.48-52. Nevertheless, the neckline of the inverted H&S with the weekly resistance level marked on the chart (zoomed in) should be kept in focus.
That said, any close below the low end of the zone may embolden sellers to press USDJPY towards 107.30. Further close below this level could send the price towards 105.50. However, the weekly support levels underscored on the chart need to be watched closely.
Written By: Mahmoud Alkudsi
Please feel free to contact me on Twitter: @Malkudsi


