


To receive Tyler’s analysis directly via email, please SIGN UP HERE
USD/JPY Rate Forecast Talking Points:
- USD/JPY Price Forecast: USD/JPY has retraced higher within a firmly entrenched downtrend
- Institutions are exiting their JPY short positions at the fastest pace since August
- USD/JPY Rate Insight from IG UK: 3.15:1 long to short ratio by retail favors further declines
Markets have a funny way of zigging when the majority expects a zag. The USD/JPY rate is a perfect example.
A Correlation Flip of Historic Proportions
If one trader looked at the positive correlation to US Treasury 2yr yields in August of last year to USD/JPY and heard that yields have since moved higher by ~80% since then, it’d be fair to assume without looking at the markets today that USD/JPY is likely nearing 120.
Of course, that’s nowhere near the current rate. While the rate has rebounded to 107 and is sitting at resistance as outlined in this bearish analyst pick, there are credible views in the market that we have lower to go still despite this historical correlation flip in USD/JPY to US front-end yields.
The correlation reached as high as +0.95, correlation coefficients are bound by +1 to -1, and is currently at -0.92 when studied over a 40-day period. While you could conclude this is unsustainable; it’s worth noting that correlations, like markets, can hold a seemingly ‘incorrect’ view for a long time. The adage that markets can stay irrational longer than you can stay solvent may ring especially true when you look below to the retail positioning.
Institutions Drop JPY Shorts Aggressively
Another cause for caution on celebrating JPY weakness is the disparity between institutional positioning and retail positioning. Per internal positioning data, retail traders at IG UK had remained net-long since Dec 29 when USDJPY traded near 113.0; theprice has moved 5.2% lower since then, and the number of traders net-long has risen by 9.2% since last week.
At the same time, Leveraged Funds often thought of as Hedge Funds per the CFTC data in the week ended February 13th have aggressively reduced their net short JPY position from 100,432 contracts to 61,386. This reduction of a short position on JPY futures, or unloading their view of higher USD/JPY, is the fastest clip of short position unloading since August.
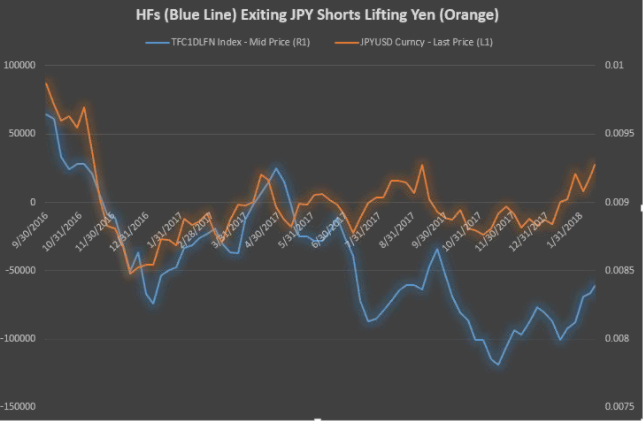
Chart created by Tyler Yell, CMT. Data provided by Bloomberg
USD/JPY Chart: Overbought In Confirmed Downtrend
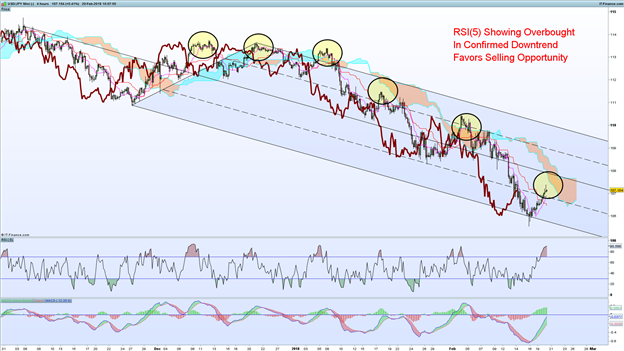
Chart created by Tyler Yell, CMT. Tweet @ForexYell for comments, questions
On the price chart with the Ichimoku Cloud technical study applied, traders can see that price is retracing from an aggressive drop. Naturally, the question that Bulls are asking with hopes of confirmation is whether or not a base, potentially a major base, has formed in USD/JPY. If so, they would be looking to build long positions that they could scale into.
However, with Ichimoku, there is a bearish signal confirmed when the lagging line (red and bold) breaks below the cloud alongside price and is entrenched with the lagging line is below price. The chart above is an H4/ 240-minute chart, but it shows that price is retracing into the cloud while RSI(5) is showing a similar overbought signal prior to earlier declines.
The spot rate is trading at 107.30, but they key resistance to keep in mind would be two-fold. First, the future cloud top that often acts as resistance sits near 107.65. Beyond there, the February 09 spike-low of 108.05 should limit upside. A break, and close, above these levels may show a broader shift is in play, and that the HFs unloaded at the wrong-time while retail’s losing bet is finally paying off.
A deeper retracement higher would favor a move to the prior congestions range of late-January at 109/110 before the spike down to 105.55. Below resistance, an eventual return that favors hedge fund’s increasing exposure to 105.55 would be favored before a move down to the Fibonacci target at 104.20.
Unlock our Q1 forecast to learn what will drive trends for the Japanese Yen and the US Dollar by year-end!
USD/JPY Insight from IG UK Client Positioning
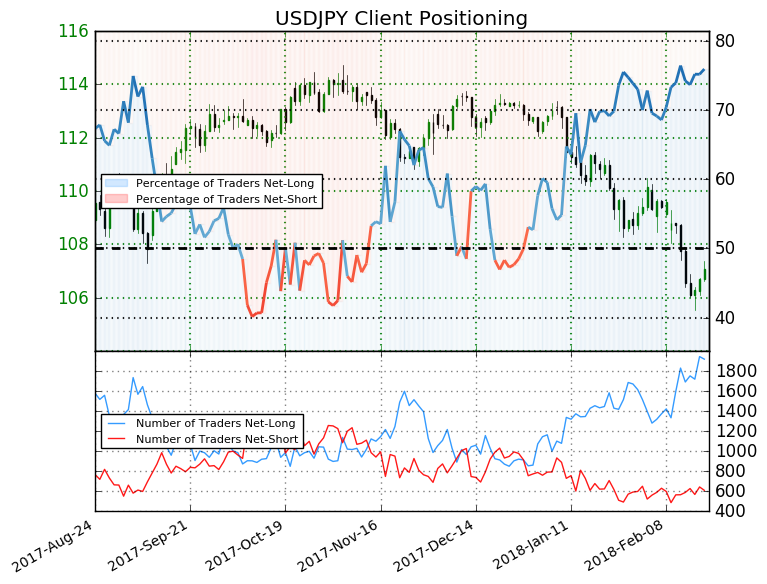
We typically take a contrarian view to crowd sentiment, and the fact traders are net-long suggests USDJPY prices may continue to fall. Traders are further net-long than yesterday and last week, and the combination of current sentiment and recent changes gives us a stronger USDJPY-bearish contrarian trading bias.
Chat about this and other markets with me below!
---
Written by Tyler Yell, CMT, Currency Analyst & Trading Instructor for DailyFX.com
To receive Tyler's analysis directly via email, please SIGN UP HERE
Contact and discuss markets with Tyler on Twitter: @ForexYell


