


To receive Ilya's analysis directly via email, please SIGN UP HERE
Talking Points:
- USD/JPY Technical Strategy: Flat
- Support: 118.90, 118.04, 116.76
- Resistance: 120.82, 121.91, 123.88
The US Dollar continued to push higher against the Japanese Yen after prices broke resistance marked by the top of a two-month-old Triangle pattern. Near-term resistance is at 120.82, the December 23 high, with a break above that on a daily closing basis exposing the 38.2% Fibonacci expansion at 121.91. Alternatively, a reversal back below Triangle top resistance-turned-support at 118.90 opens the door for a test of a recently broken channel top at 118.04.
While entering long appears compelling, we will tactically opt to pass. The correlation between USDJPY and the S&P 500 implies the pair may suffer from risk aversion following a fruitless Eurozone finance ministers’ meeting earlier today. With that in mind, we will stand aside.
Add these technical levels directly to your charts with our Support/Resistance Wizard app!
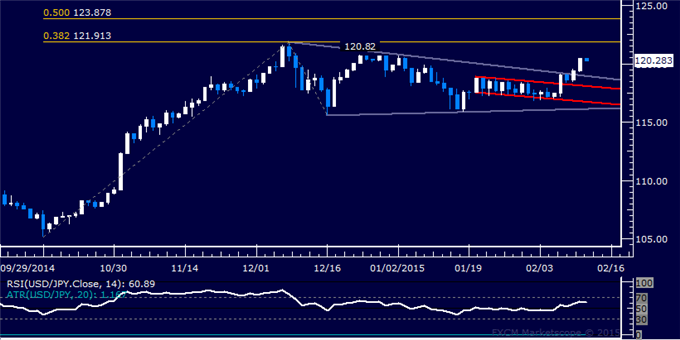
Daily Chart - Created Using FXCM Marketscope
--- Written by Ilya Spivak, Currency Strategist for DailyFX.com


