


Canadian Dollar and Brent oil Price
- USD/CAD charts and analysis
- Crude Oil price charts and analysis
Have you seen our newest trading guides for USD, EUR and Gold ? Download for free our latest forecasts
Bullish USD/CAD with Bearish Crude Oil
On Friday USD/CAD ended the weekly session in the red for the first time in six weeks. However, the weekly candlestick closed with a bullish Doji pattern highlighting buyers are not done yet.
On the other hand, on August 15 Brent oil corrected higher after creating a higher low at $57,47 since then, the price has been trading ineffectively.
On August 29, the Relative Strength Index (RSI) created a higher low at 55 on USD/CAD reflecting buyer’s come back. Meanwhile, the oscillator pointed lower on Brent from 52 to 45 indicating to seller’s resuming bearish momentum.
Just getting started? See our Beginners’ Guide for FX traders
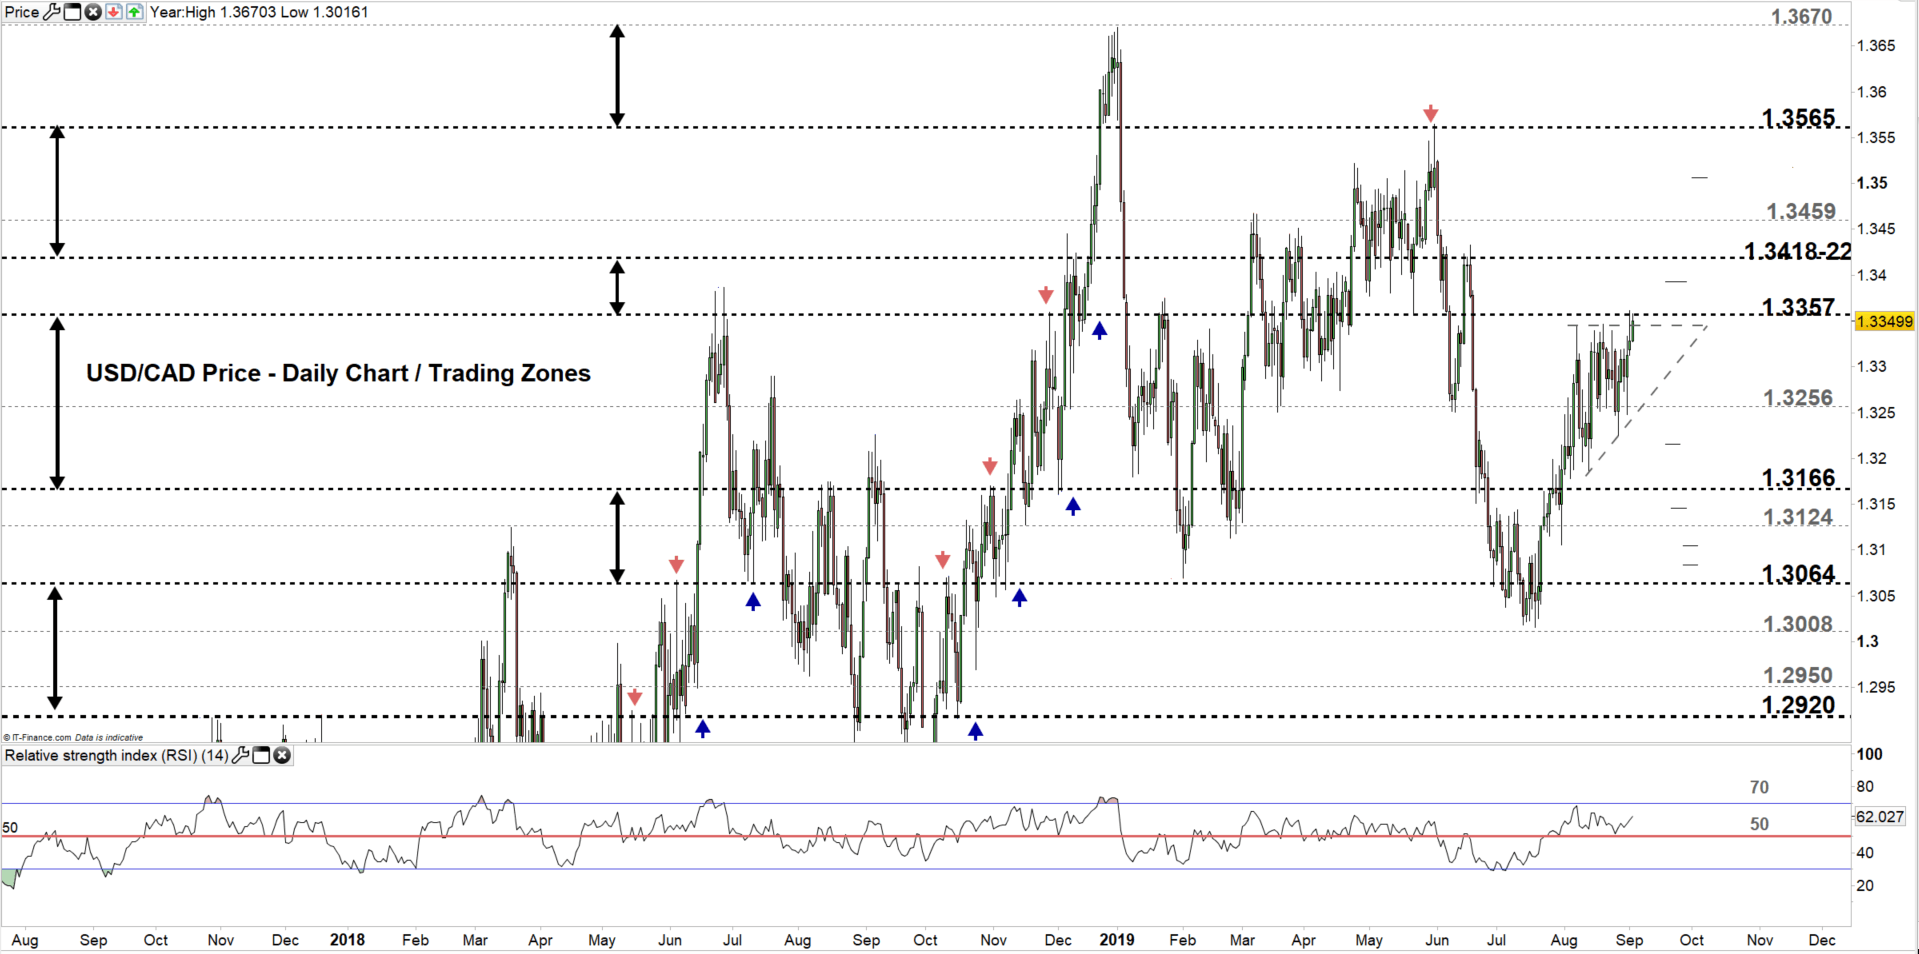
USD/CAD DAILY PRICE CHART (Aug 1, 2017 – Sep 3, 2019) Zoomed Out
USD/CAD DAILY PRICE CHART (June 15 – SEp 3, 2019) Zoomed In
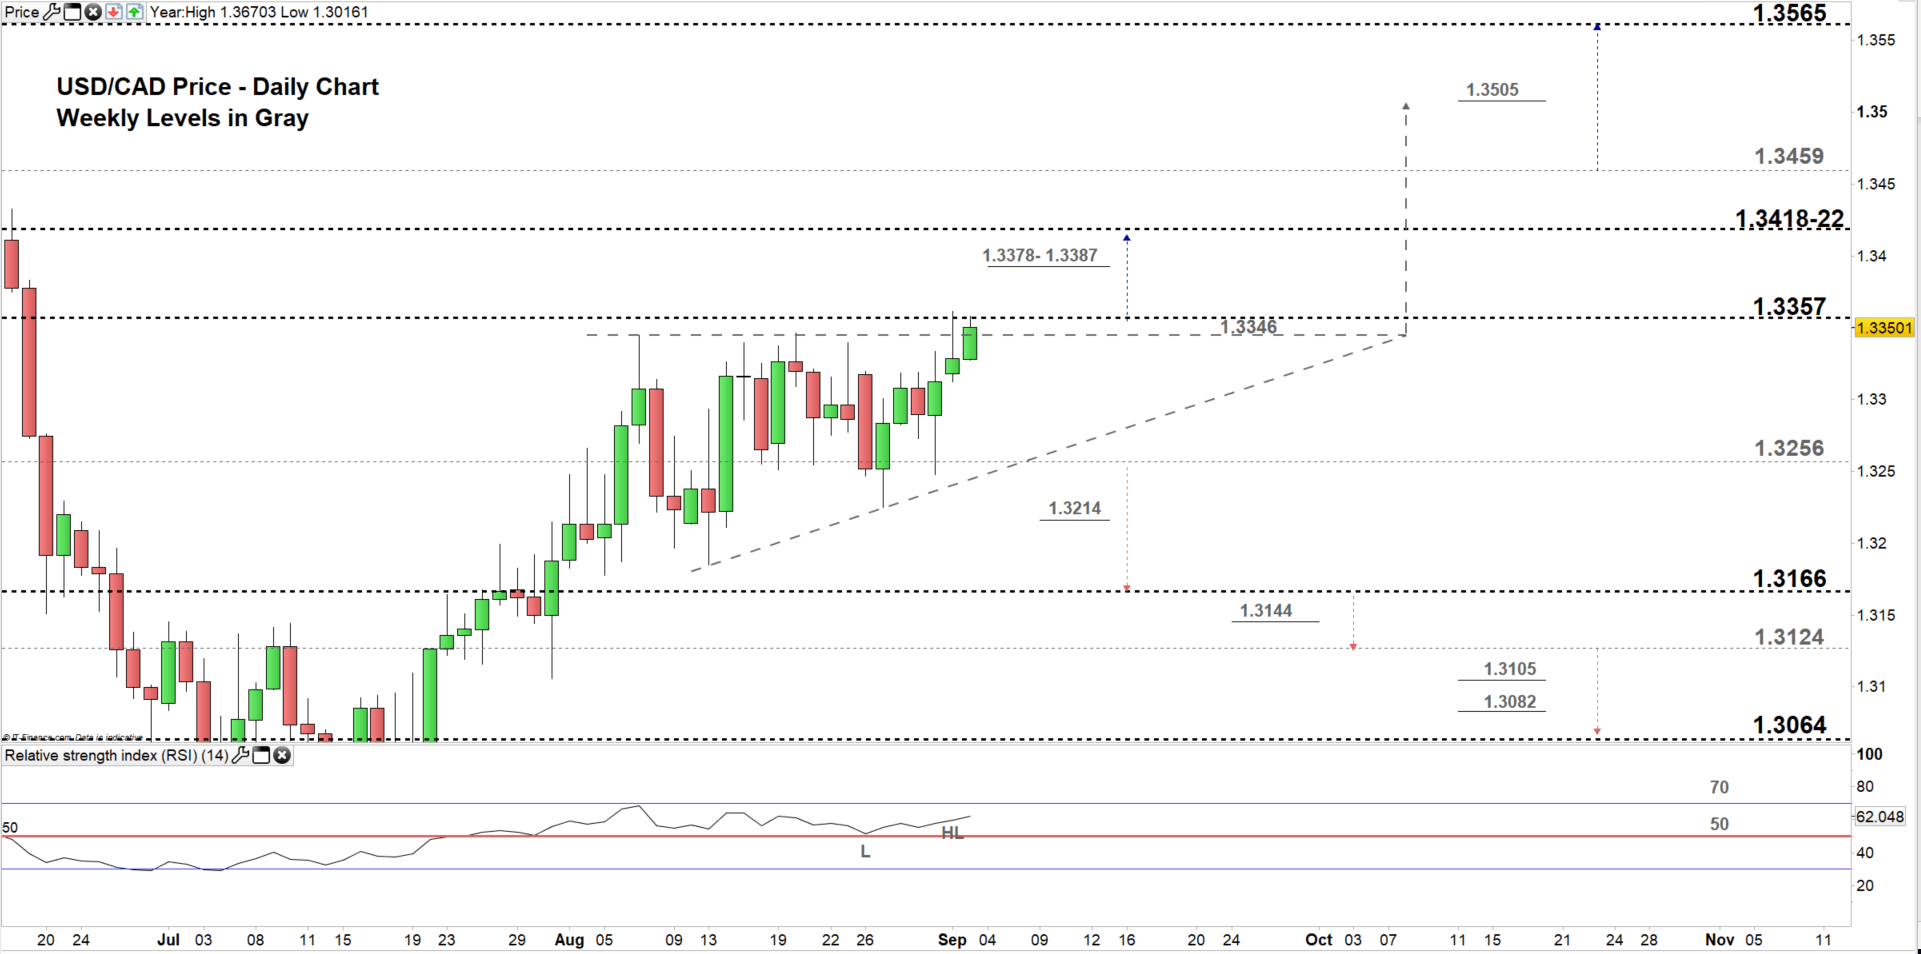
Looking at the daily chart, we notice at the start of the week USD/CAD opened with a gap to the upside, then rallied above the high line of the ascending tringle discussed in our previous update eyeing a test of 1.3505. The pair rebounded nearby the end of current trading zone 1.3256 -1.3357.
Therefore, any close above the high end of the zone could push USD/CAD towards the vicinity of 1.3418-22. That said, buyers would need pay a close attention at the weekly resistance area marked on the chart (zoomed in). Further close above 1.3422 may mean more bullishness towards 1.3459.
In turn, any failure in closing above the high end may reverse USD/CAD course sending the price back towards the low end. Further close below the low end could mean more bearishness towards 1.3166. With that Scenario, sellers need to consider the weekly support level underlined on the chart.
Having trouble with your trading strategy? Here’s the #1 Mistake That Traders Make
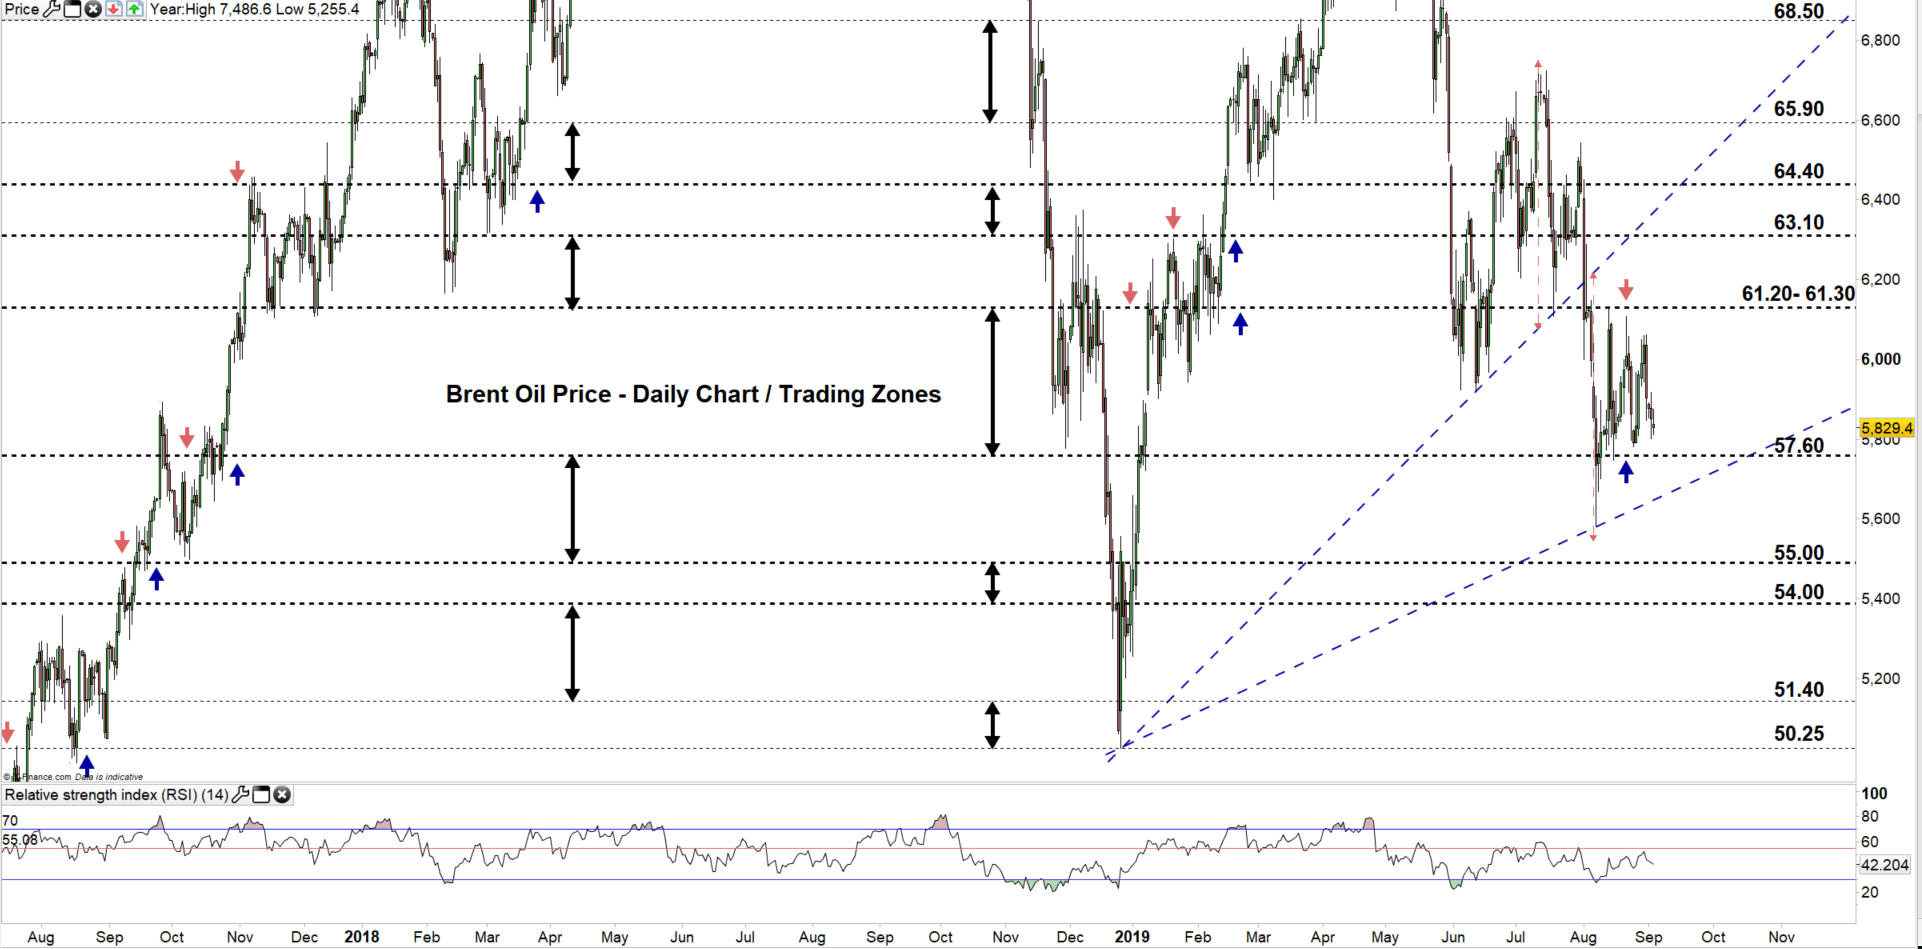
Brent Oil DAILY PRICE CHART (Aug 1, 2017 – SEP 3, 2019) Zoomed Out
Brent Oil DAILY PRICE CHART (June 10, 2017 – Sep 3, 2019) Zoomed In
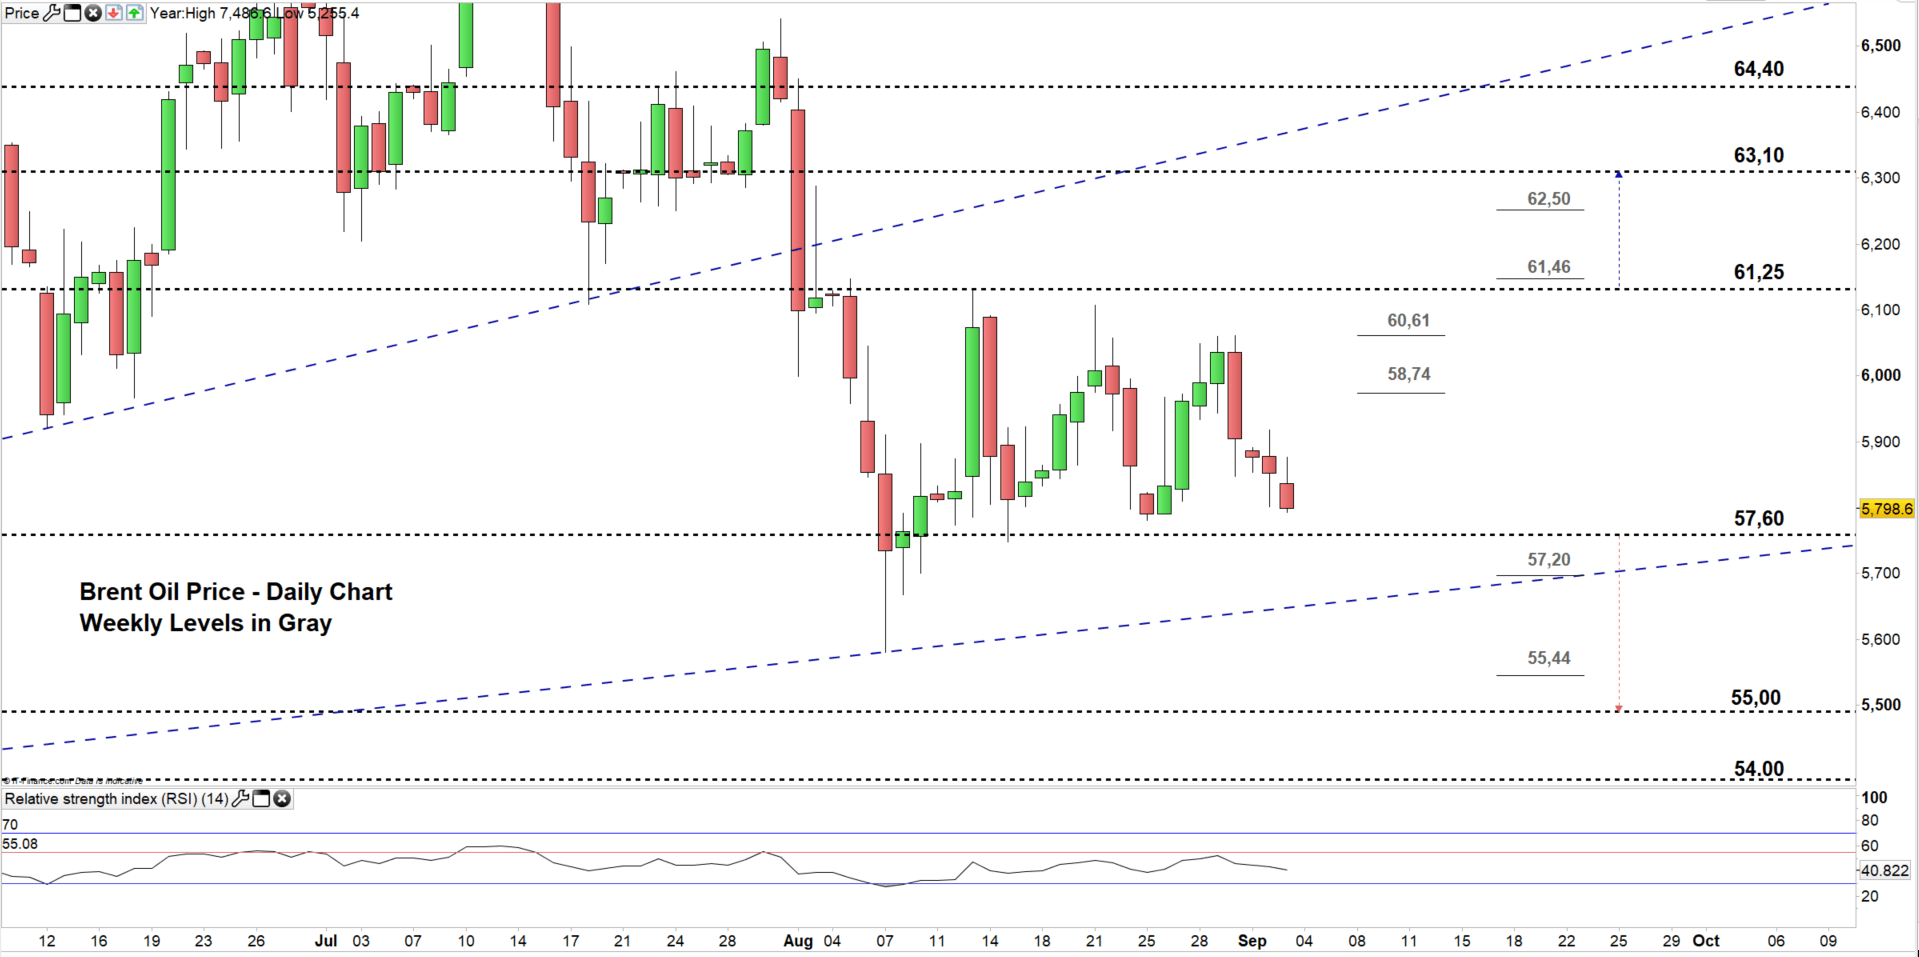
From the daily chart, we notice on August 15 Brent oil rebounded from the low end of current trading zone $57,60- $61,25 since then, the price stuck in this zone and failed at the end of August to continue its rally towards the high end.
Hence, a close below the low end could send the black gold towards $55,00. Although, the weekly support levels underscored on the chart (zoomed in) would be worth monitoring.
On the flip-side, any failure to close below the low end could send the price back towards the high end. Nonetheless, the weekly resistance levels underlined on the chart should be kept in focus. A close above the high end could open the door to a further bullish move towards $63.10. However, the weekly resistance levels marked on the chart need to be watched cloely.
Written By: Mahmoud Alkudsi
Please feel free to contact me on Twitter: @Malkudsi


