USD/CAD Price Outlook, Charts and Analysis
Did we get it right with our US Dollar forecast? Find out more for free from our Q2 USD and main currencies forecasts
USD/CAD – Bears Still in Charge
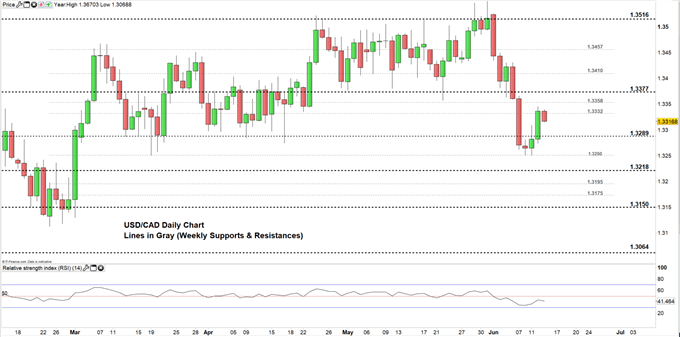
On June 6, bearish momentum sent USD/CAD tumbling through the consolidation zone (1.3377 – 1.3516). On June 11 the pair rebounded from the 19 March low at 1.3250 and rallied after printing its lowest level in nearly three months.
The relative Strength Indicator (RSI) continues creating lower highs and remains below 50 emphasizing the bearish outlook of USD/CAD.
Having trouble with your trading strategy? Here’s the #1 Mistake That Traders Make
USD/CAD DAILY PRICE CHART (FEB 14, 2019 – JUn 13, 2019) Zoomed In

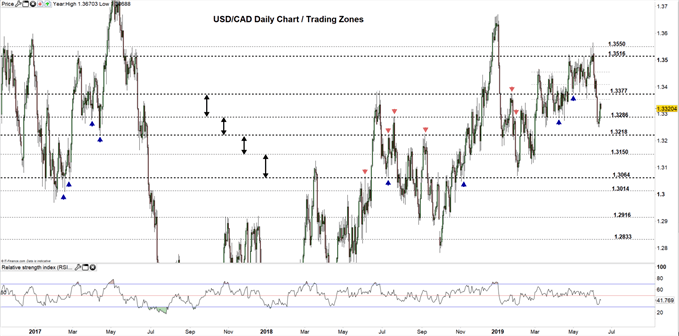
USD/CAD DAILY PRICE CHART (Nov 9, 2016 – JUnE 13, 2019) Zoomed Out

A close look at daily chart shows USD/CAD eying to rally towards the high end of the current trading zone (1.3289 – 1.3377) however, the pair needs to clear the weekly resistance at 1.3358. Any failure to close above the high end may see the price fall back to the low end of the range.
Further bearish move requires USD/CAD to fall to the lower trading zone (1.3218 – 1.3289) therefore, any close below 1.3289 might lead the price towards the low end, however, the weekly support at 1.3250 ( the 11 Jun low) needs to be kept in focus.
Just getting started – need a hand? See our Beginners’ Guide for FX traders
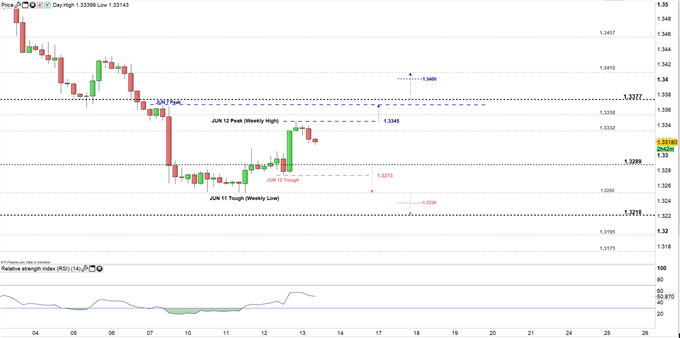
USD/CAD Four-HOUR PRICE CHART (Jun 3, 2019 – Jun 13, 2019)

Looking at the four-hour chart, yesterday USD/CAD peaked at 1.3345 printing its highest weekly level, then the price slipped closing on bearish Doji pattern. Therefore, if the pair rallies above the weekly high then it could head towards the June 7 peak at 1.3366. Although, the weekly resistance at 1.3358 needs to be considered. See the chart for the key levels if the price continues to rally above 1.3377.
On the other hand, if the bears take charge then any break below 1.3289 could send the price towards the June 11 trough (weekly low) at 1.3250. However, the support level at 1.3273 (the June 12 low) should be watched closely. See the chart for the key levels if the selloff continues below the weekly low.
Written By: Mahmoud Alkudsi
Please feel free to contact me on Twitter: @Malkudsi


