


Talking Points
-USD/CAD reaches highest level in 4 months
-Tight confluence of resistance in USD/CAD near 1.3304-1.3381
-Follow GSI and SSI in the resistance zone for clues if the price zone may hold or break
USD/CAD has broken the range and has reached its highest level in 4 months. Renewed US Dollar strength is helping to lift the pair higher.
There is a confluence of resistance USD/CAD will need to push through to tack on any meaningful gains. There are 4 levels of resistance joining in an 80 pip range that is likely to slow down or possibly resist prices.
- 200 Day Simple Moving Average (1.3304)
- 38.2% retracement of the Jan 20 to May 3 2016 down trend (1.3315)
- Proposed yellow wave c = yellow wave a (1.3344)
- Proposed wave Y = wave W (1.3381)
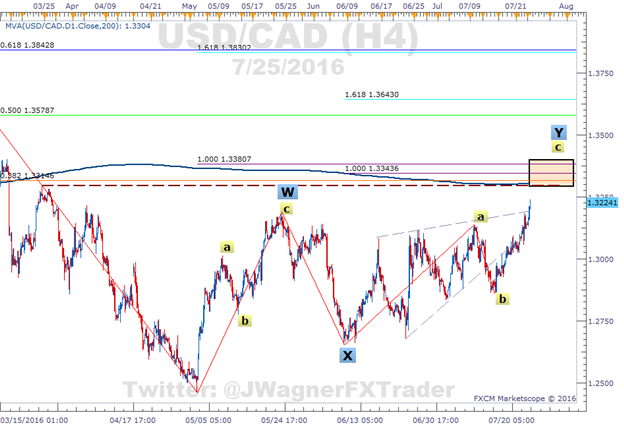
In the labeling above, ‘W’ and ‘Y’ are proposed zig zags, which is an Elliott Wave pattern. Oftentimes, the ‘c’ waves have an equality distance to the ‘a’ waves which is the basis behind the 3rd and 4th resistance points above.
Therefore, we have a confluence of resistance forming in the 1.3304-1.3381 price range. Due to the multiple levels of technical resistance, it has a higher probability chance of slowing down or repelling prices. A break above the 1.3304-1.3381 range does open the door to 1.36.
If prices are resisted and if a down trend resumes, then support levels come into play near 1.3150 and 1.3000.
A couple of early warning tools we can use to assist us in trading around the above price levels are GSI and SSI.
Grid Sight Index (GSI)
GSI is a big data indicator that analyzes millions of prices points and thousands of trend components in real time to determine how the current price pattern stacks up against some historical patterns. The result is a percentage indicating the number of historical patterns that moved higher and the number of historical patterns that moved lower.
Therefore, use GSI on USDCAD ‘m3’ or ‘m5’ to see how the historical patterns compared when the price approaches the levels mentioned above.
Keep in mind that just because a certain pattern moved a certain way in the past doesn’t mean that pattern will work itself out in the same fashion moving forward.
Speculative Sentiment Index (SSI)
SSI has been shifting lower prior to this recent break higher. This is a result of the number of short traders hitting their highest level in 5 months. SSI is a contrarian type of indicator that can provide clues about price movement depending on how sentiment is shifting. So if short traders are entering into the trades, then we would look to do the opposite.
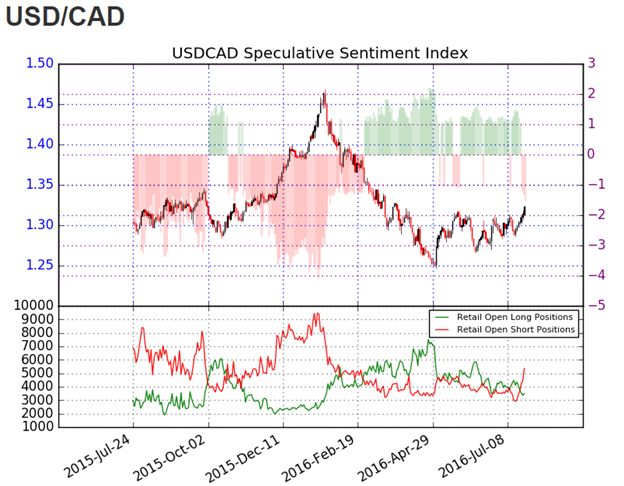
As price enters into one of the cited levels above, see how SSI shifts and then do the opposite. See live trader positioning via SSI here.
Bottom line, look for USDCAD to experience difficulties pushing through the confluence of resistance. GSI and SSI can provide us with some early warning signs if the levels are going to break and if USDCAD moves higher or if the levels are going to hold and repel prices lower.
Interested in a quarterly outlook for USD or other markets? Download our quarterly forecast here.
---Written by Jeremy Wagner, Head Trading Instructor, DailyFX EDU
Follow me on Twitter at @JWagnerFXTrader .
See Jeremy’s recent articles at his Bio Page.
To receive additional articles from Jeremy via email, join Jeremy’s distribution list.


