


U.S. Indices Technical Outlook:
- S&P 500 cash index reversed off resistance
- Nasdaq 100 ran aground into a significant trend-line
- Dow Jones range failure breakout is bearish price action

S&P 500, Nasdaq 100, Dow Technical Outlook for the Days Ahead
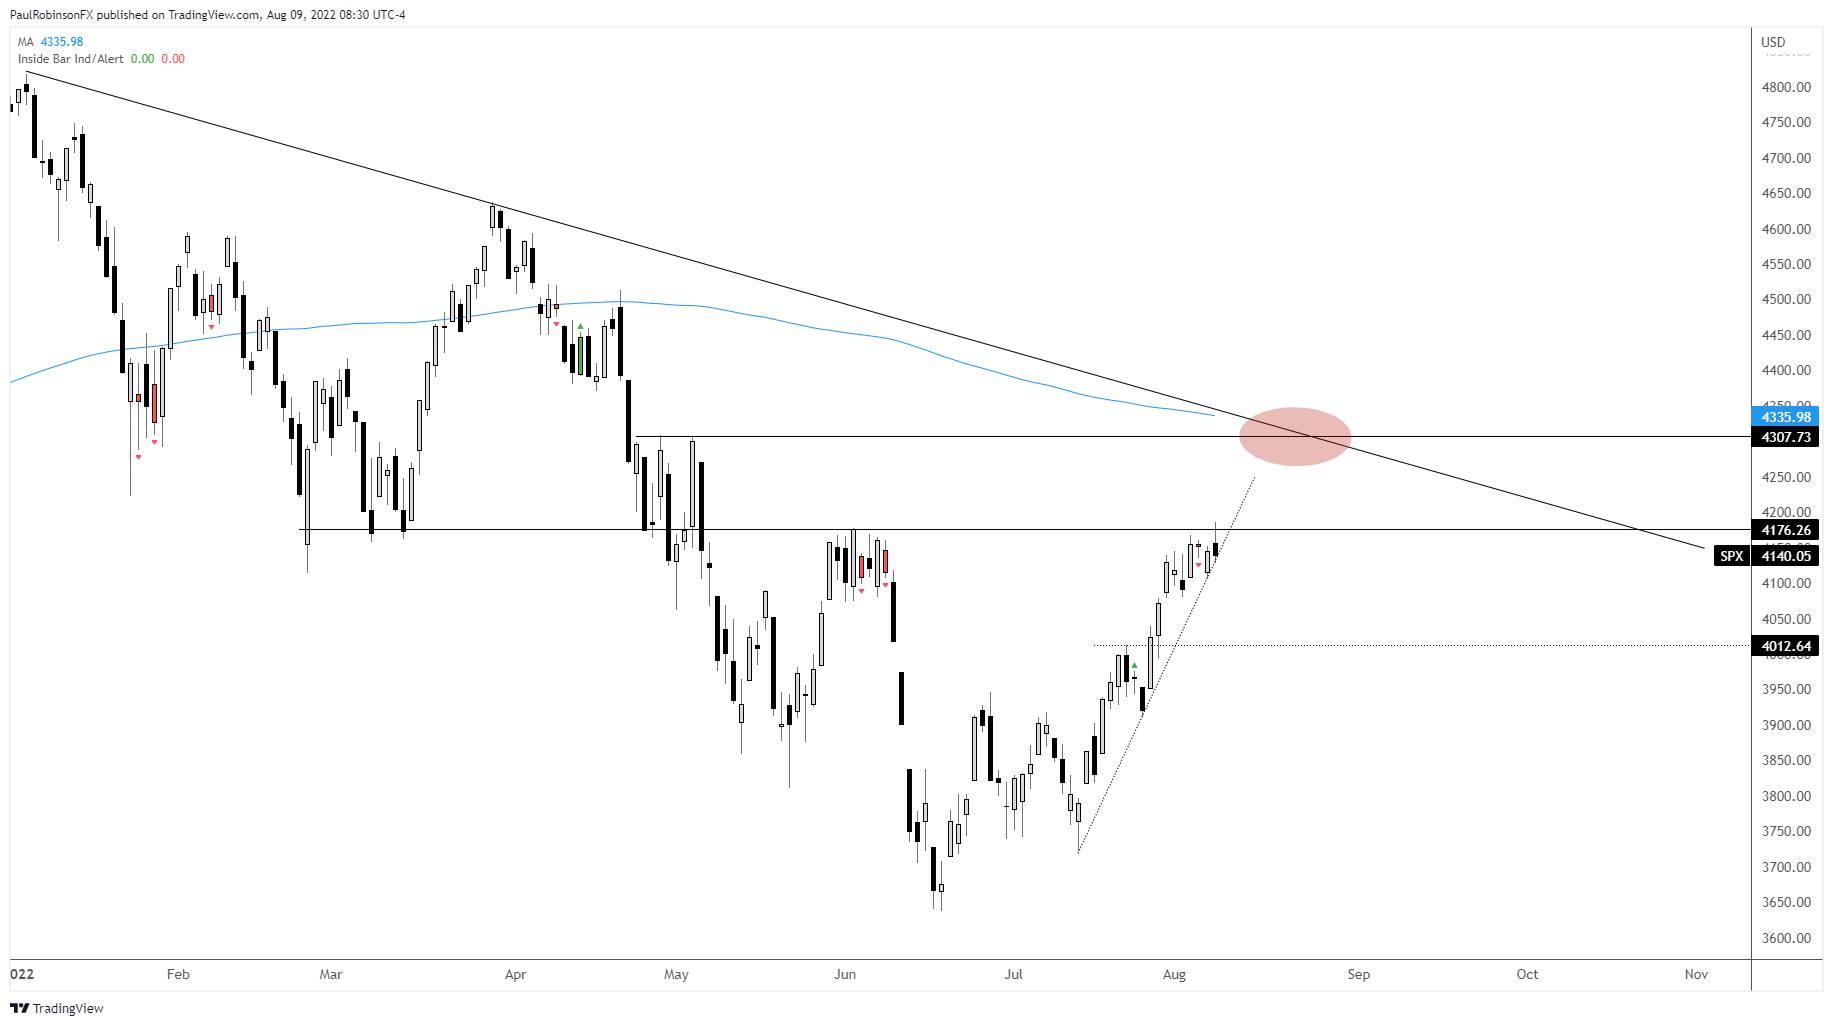
The S&P 500 ran aground to start the week by tagging off on the high from early June, a level created from March when the market put in a temporary low. The reversal yesterday had the downside coming into play and this morning we are starting to see a little follow through.
The question will be just how much follow-through we get. There aren’t any particularly great levels to turn our attention to, but there is in the NDX which we will get to in a minute. Watching the NDX support level will be key for the broader market.
The thinking is that we will get a fall swoon to start in the weeks ahead, but will it come from current levels or a little bit higher is the big question. For now, keeping it to the short-term the downside should be in play in the days ahead. A reversal and close back above the cash high at 4186 will turn momentum back towards bullish.
S&P 500 Daily Chart
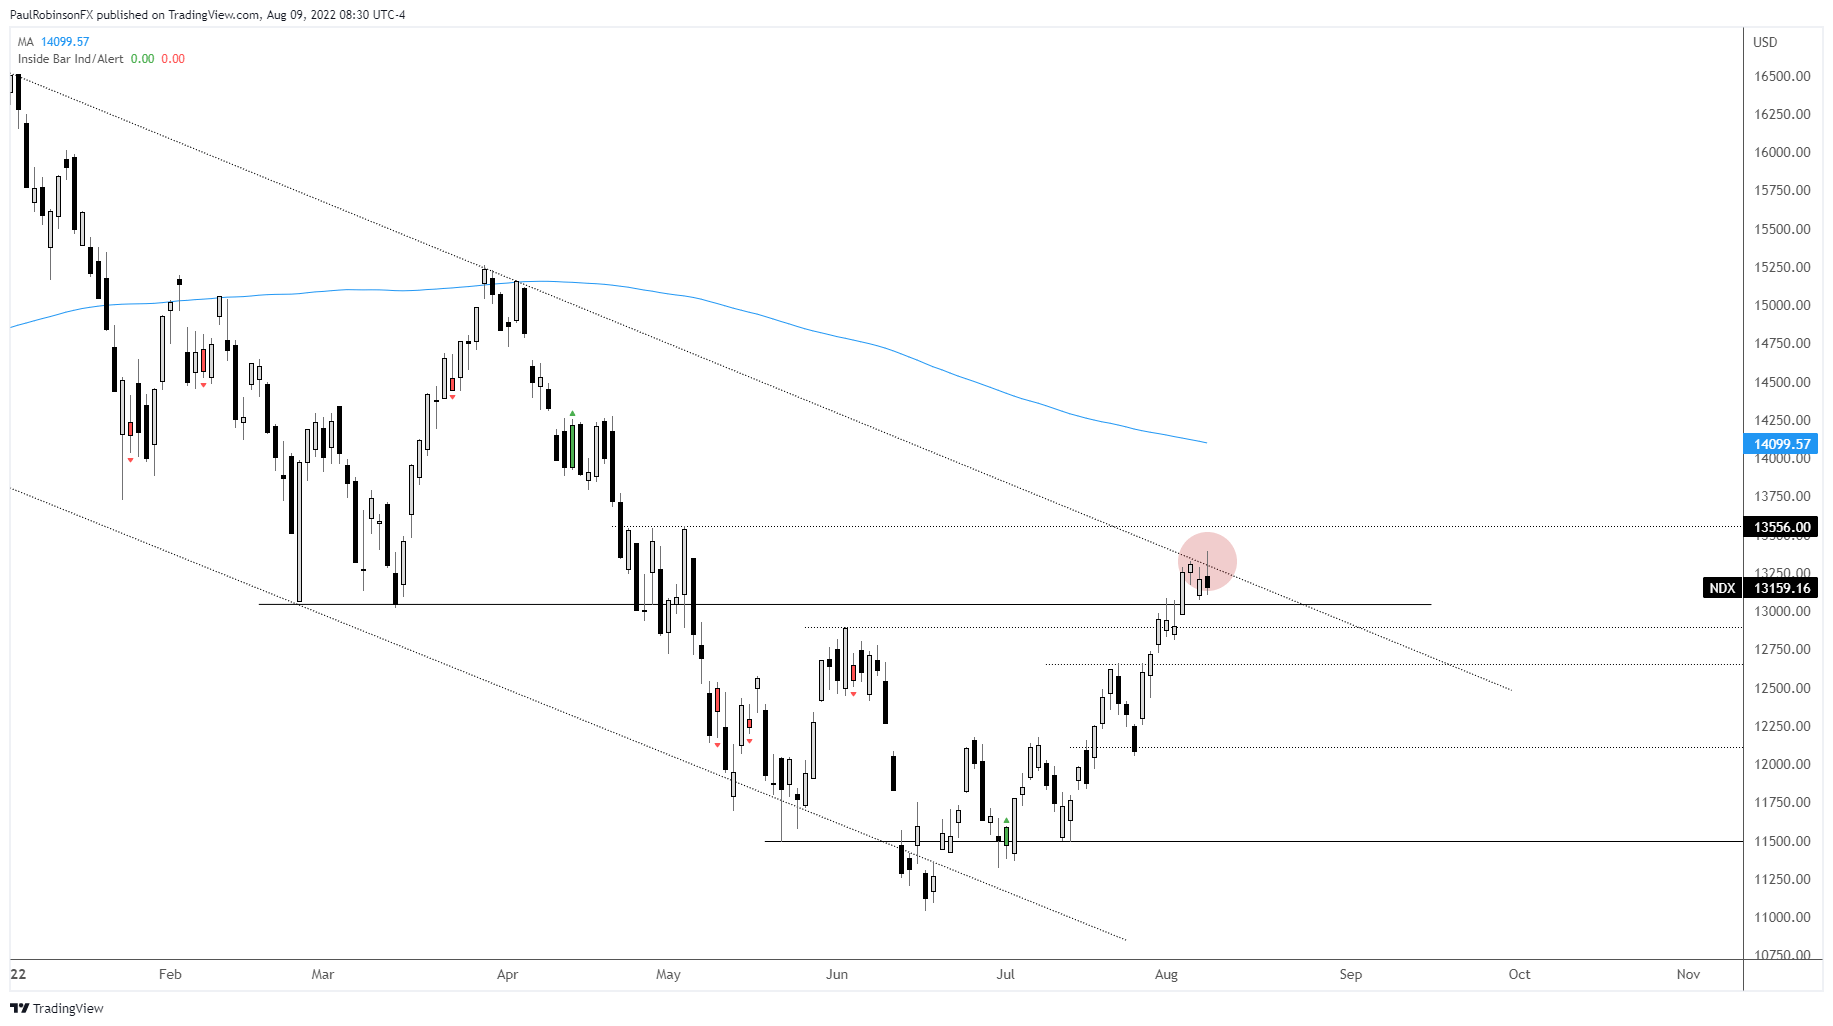
The Nasdaq 100 showed stalling momentum off the trend-line back to December, but yesterday’s pop and reversal suggests the market now wants to retrace at the least. There is immediate support in the area to watch around the 13020/12897 vicinity. Perhaps this caps the downside and we see a bid, but if it breaks then more downward pressure is anticipated.
It is possible that the touching of this trend-line and turn down is the beginning of a much larger move lower, but we will first need to see how the decline starts to unfold and whether the market can regain its footing quickly or not.
Nasdaq 100 Daily Chart
Nasdaq 100 Chart by TradingView
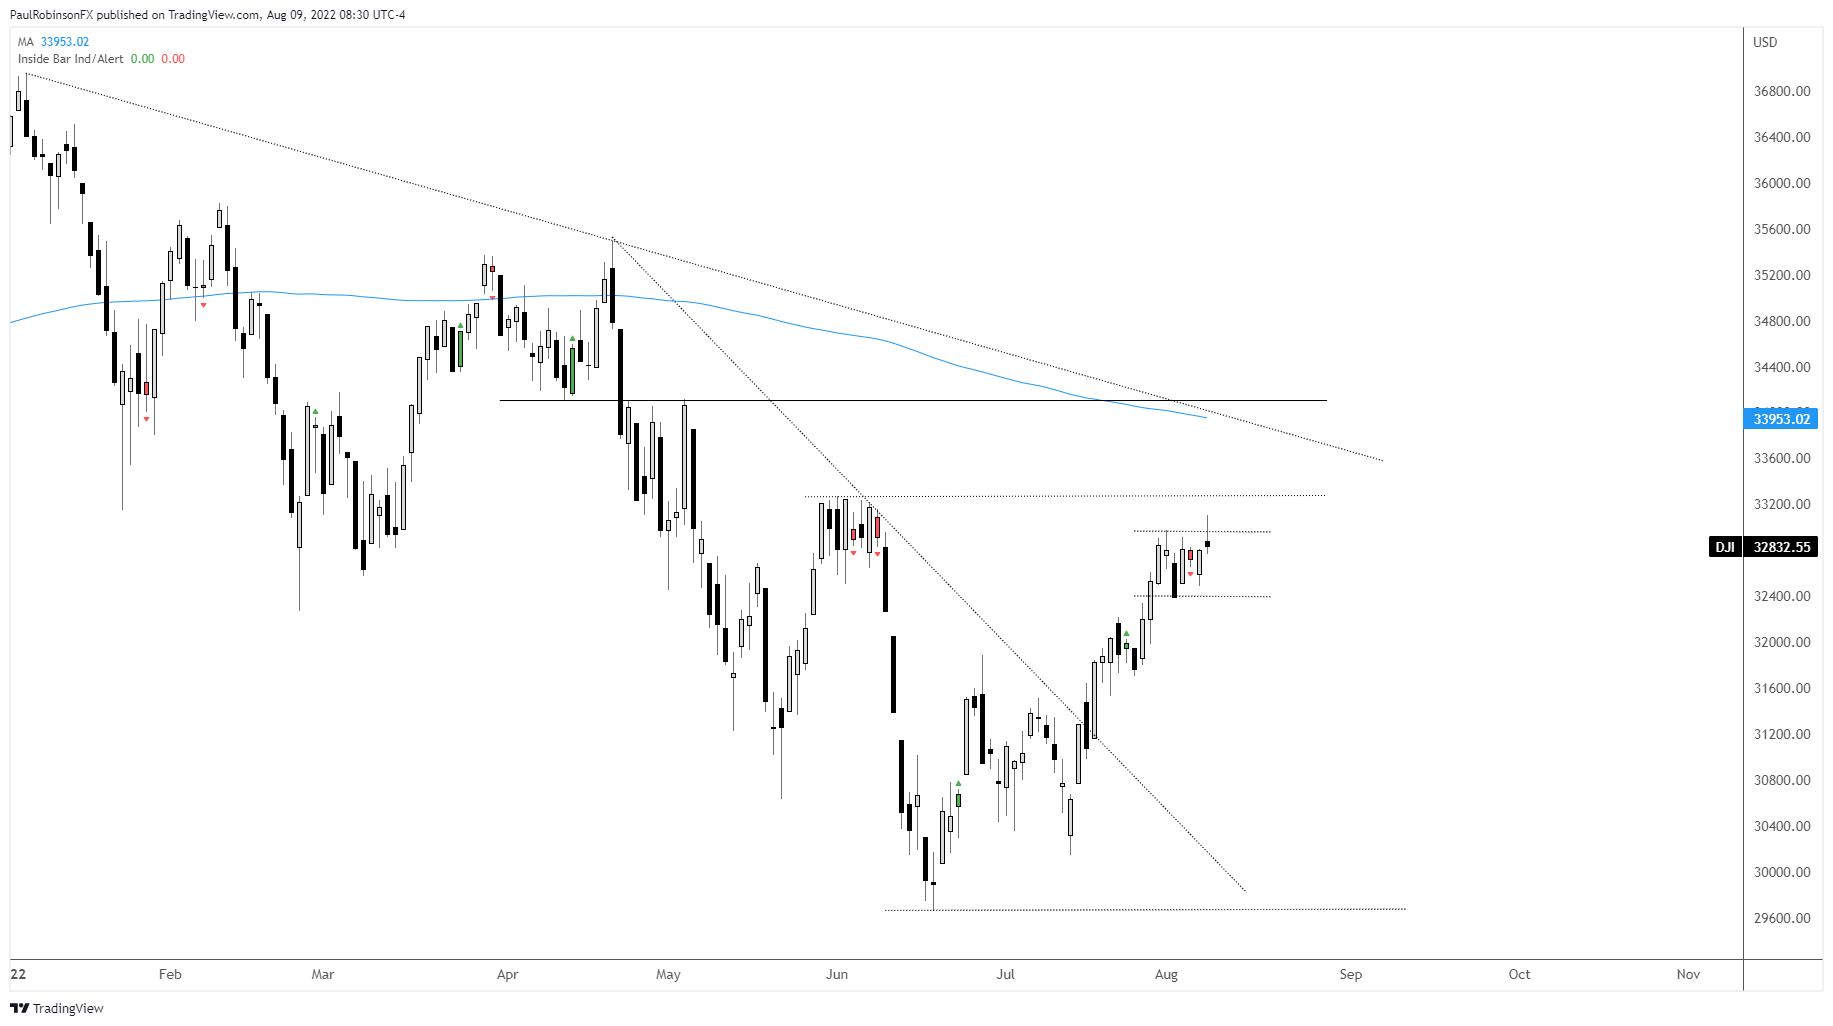
The Dow Jones was putting in a range and when it came out of it yesterday the rally looked set to continue, but a swift reversal back inside a range is often a strong signal that we will see lower levels. Typically the other side of the range at the least, but if that breaks then a larger move is expected.
The low of the range to watch is 32387. If we see the market hold up and take out yesterday’s high at 33109, it won’t take long for the early June highs to come into play as resistance at 33272.
Dow Jones Daily Chart
Dow Jones Chart by TradingView
Resources for Forex Traders
Whether you are a new or experienced trader, we have several resources available to help you; indicator for tracking trader sentiment, quarterly trading forecasts, analytical and educational webinars held daily, trading guides to help you improve trading performance, and one specifically for those who are new to forex.
---Written by Paul Robinson, Market Analyst
You can follow Paul on Twitter at @PaulRobinsonFX


