


U.S. Indices Technical Outlook:
- Stocks appear to have more upside still
- It may be a bumpy ride up before another big down-move
- Levels to watch for the S&P 500, Dow, and Nasdaq 100

S&P 500, Dow Jones, Nasdaq 100 Outlook: Upward Bias Still Intact
To be clear, the market, in my view, is in the early days of an extended bear market, however; there is will be rallies along the way that spark short-term optimism. Some rallies will be sharp, some more subtle, and some a mixed bag. The move off the May low began with a good amount of power, but from here strength may be a bit more difficult to come by.
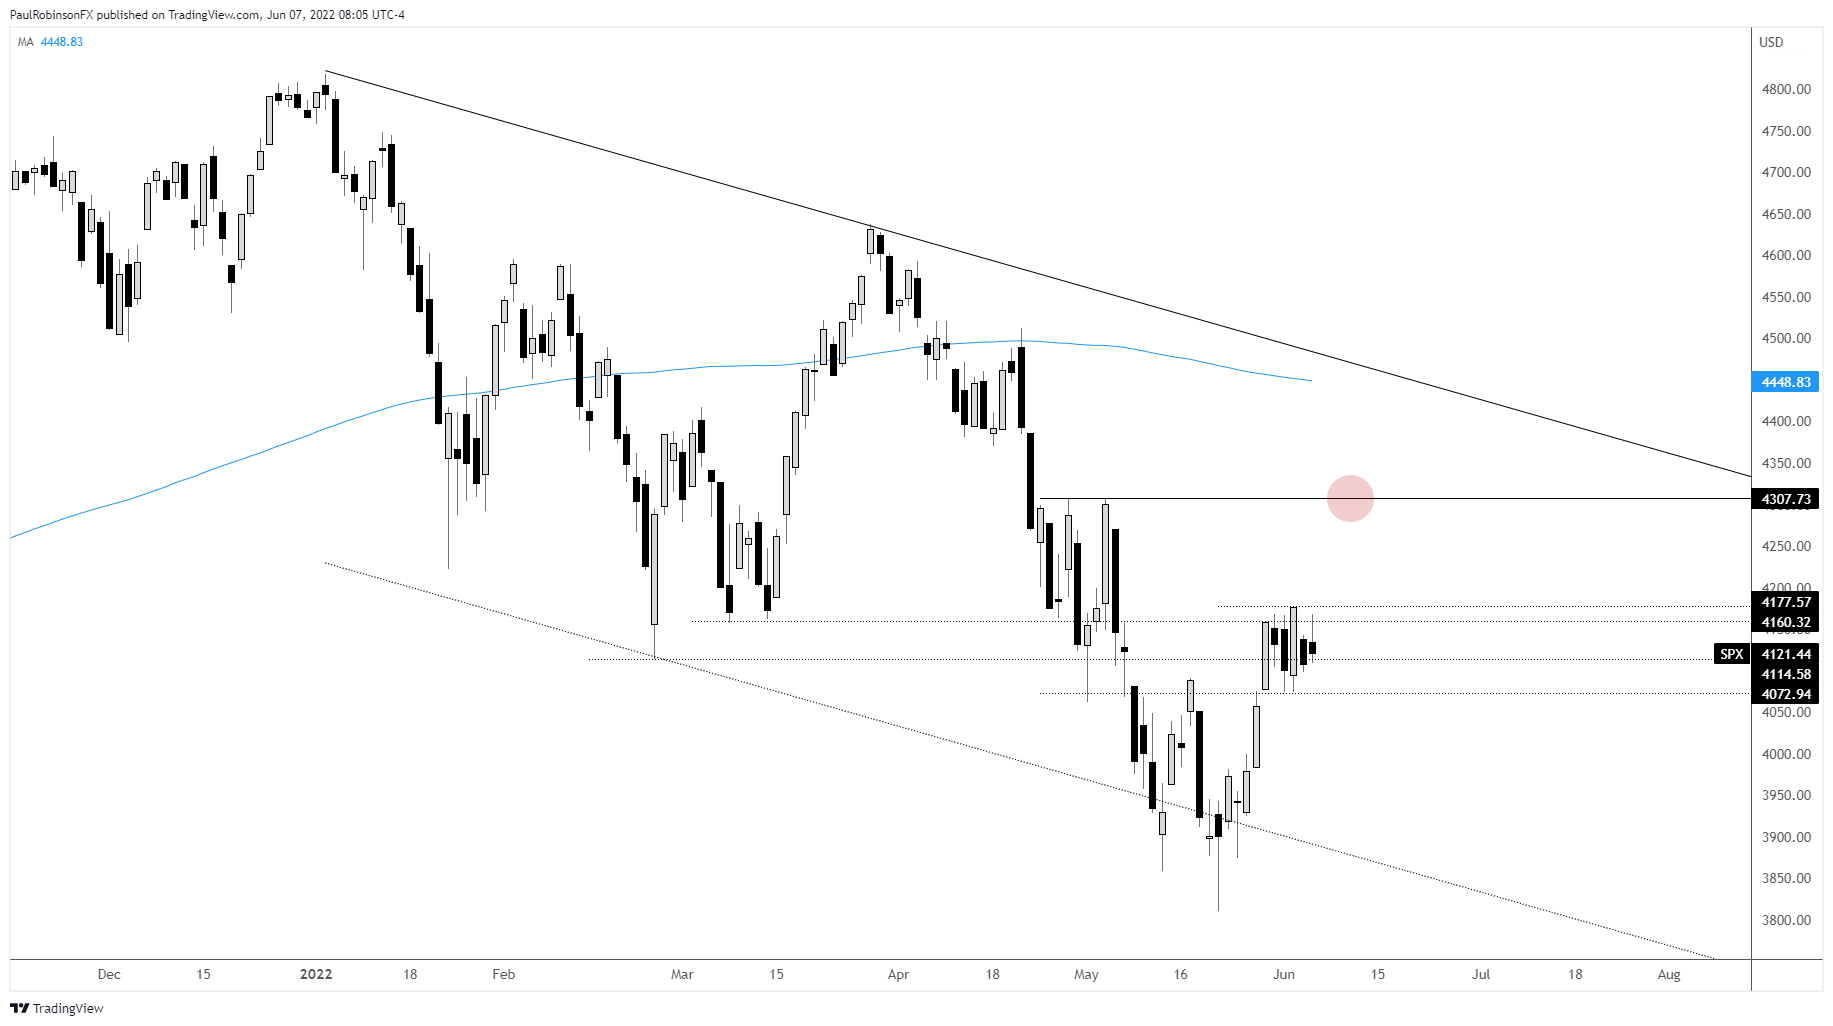
Since we didn’t see the market immediately reverse the initial thrust off the lows the consolidation period we are seeing is viewed as a positive. The S&P 500 has been ranging between 4073 and 4177, which is creating a defined set of levels to watch.
A breakout above 4177 will have the bounce heading towards 4307, with this viewed as a fairly meaningful spot to watch for a peak to form. Currently, if the bear market view is to stand strong then we should not see a rally beyond the 200-day and downward channel line off the record highs. They are in relative confluence at this time in the mid-4400s.
Should we see a strong punch below 4037 without an immediate recovery, then a test of lows at 3810 or worse may develop.
S&P 500 Daily Chart
If the Nasdaq 100 rises out of its range (less developed than the S&P/Dow) above 12897 there is fairly substantial resistance to overcome just over the 13k mark. Expect the NDX to continue to trade heavy even if the broader market can continue higher, as this index is expected to remain the downside leader in the bear market. A strong break below 12447 will have the low at 11492 in focus.
Nasdaq 100 Daily Chart
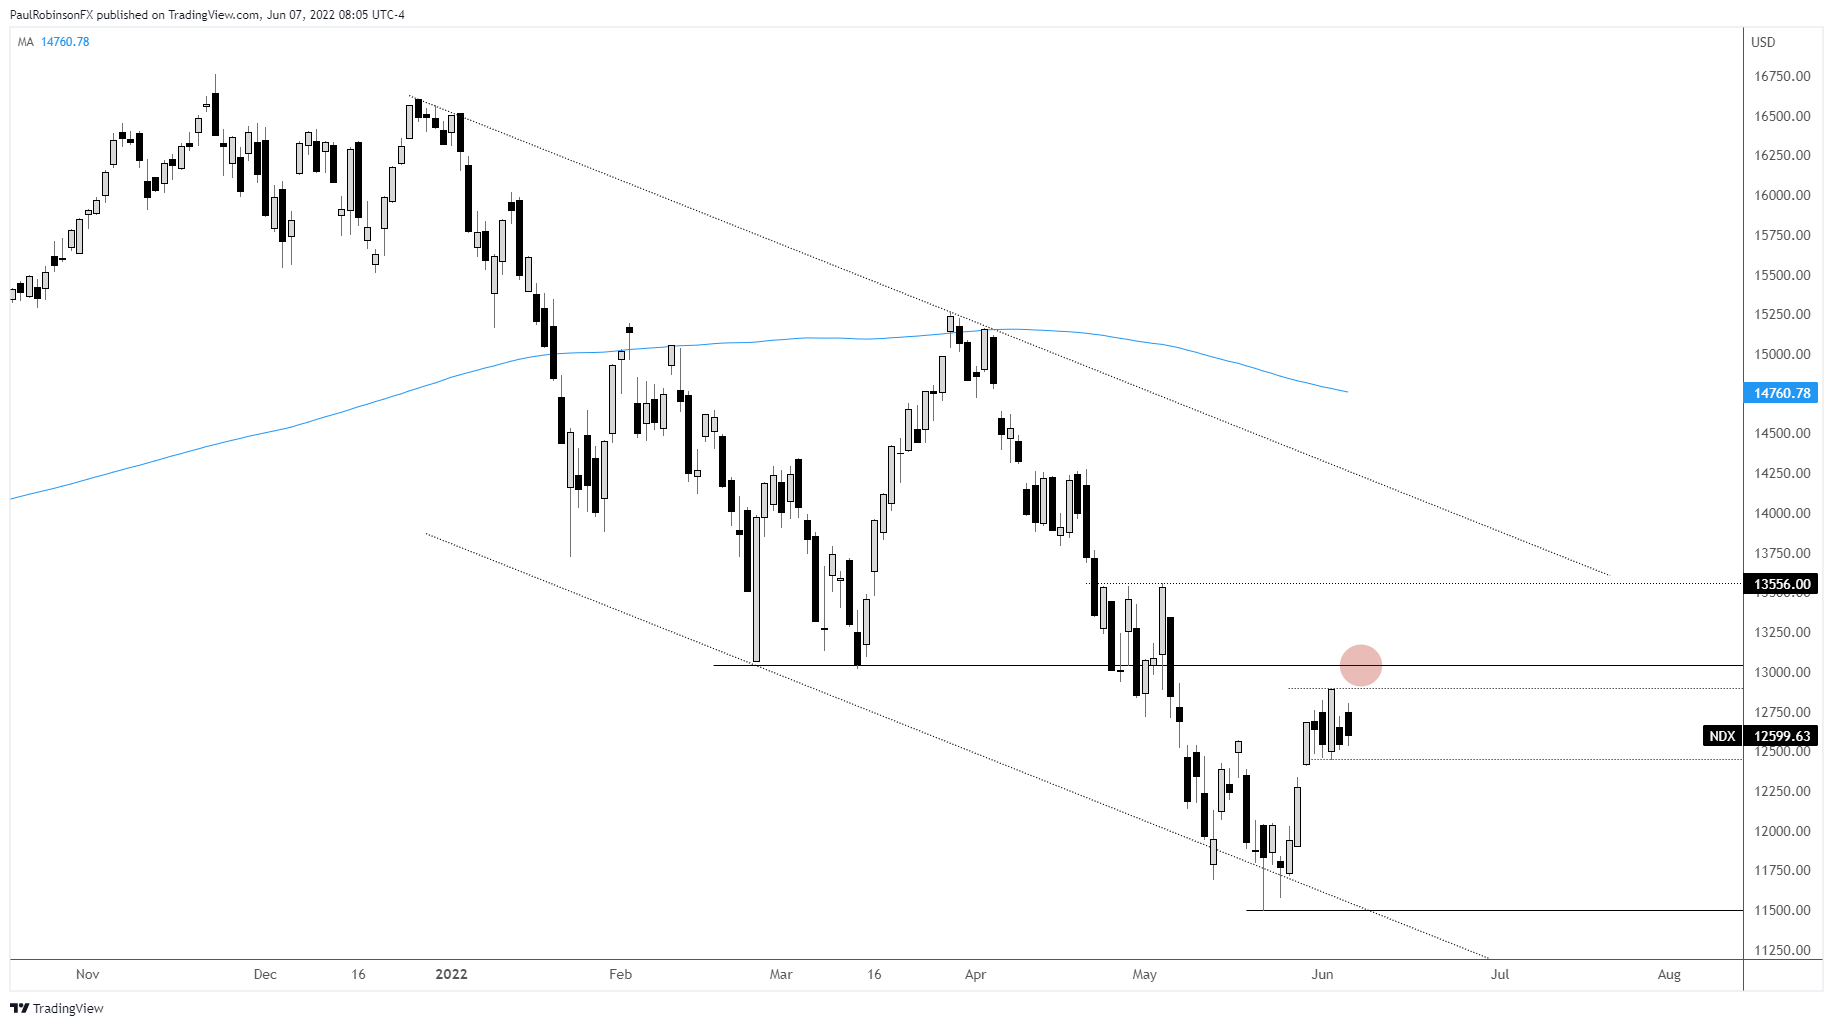
Nasdaq 100 Chart by TradingView
The Dow Jones is putting in a solid range and also trading generally stronger than the other indices, which is expected to be the case as old school stocks receive more inflows than new-school. A breakout above 33272 will have a big level at 34117 in focus. A downside break below 32509 will have the Dow leaning lower.
Dow Jones Daily Chart
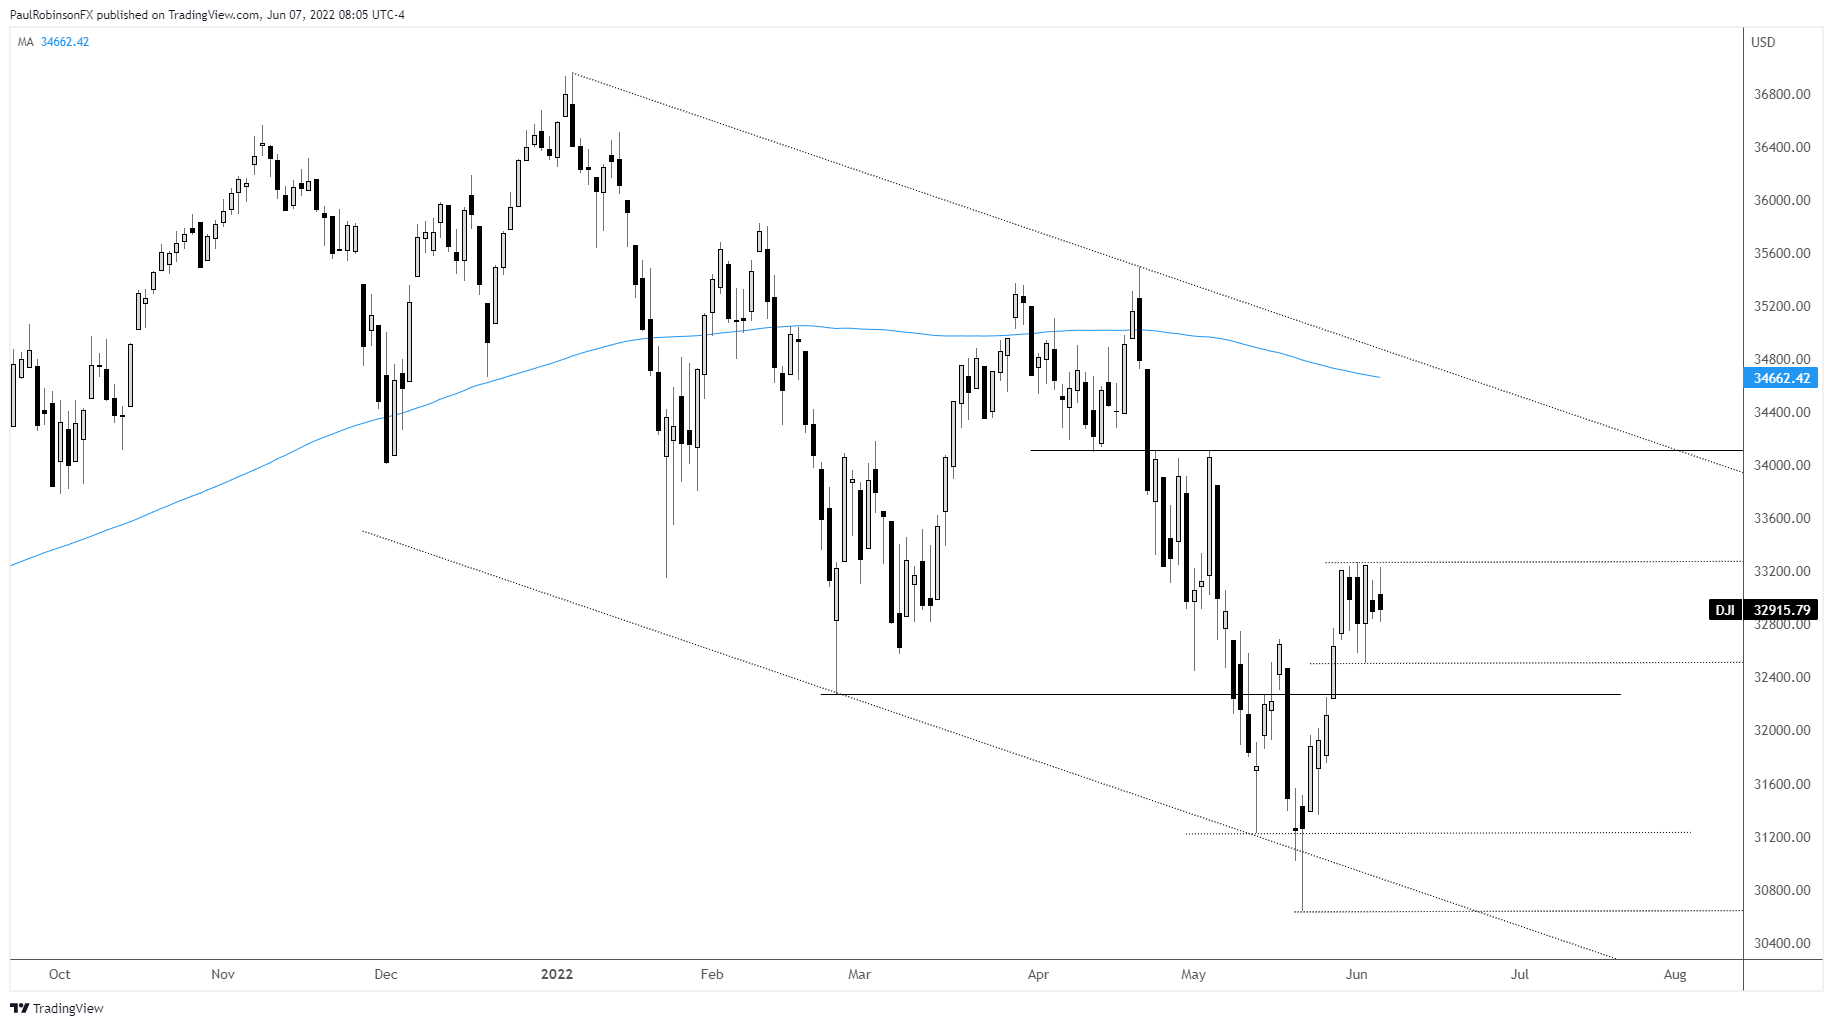
Dow Jones Chart by TradingView
Resources for Forex Traders
Whether you are a new or experienced trader, we have several resources available to help you; indicator for tracking trader sentiment, quarterly trading forecasts, analytical and educational webinars held daily, trading guides to help you improve trading performance, and one specifically for those who are new to forex.
---Written by Paul Robinson, Market Analyst
You can follow Paul on Twitter at @PaulRobinsonFX


