


U.S. Indices Technical Highlights:
Dow Jones, S&P 500, Nasdaq 100 Technical Analysis: Old School Leading
The Dow Jones continues to lead the way as old school value types forge ahead versus the bull market tech darlings of the Nasdaq 100. This has made for an interesting dynamic as we see significant divergence between the DJIA and NDX.
A fully healthy market would be better suited to see all stocks reaching new highs at the same time, but the regardless the general trend is hard to fight. Picking a top is a difficult and often unfruitful game. While this the case, the Dow has risen over 6% the past seven sessions and looks to put fresh longs at risk of a pullback.
Existing longs may want to consider buttoning up trailing stops, while new longs and shorts wait for better risk/reward set-ups. A period of consolidation above the recently breached top-side trend-lines (June 2020/November 2020) could do the market some good in catching its breath for another leg up. It could also help better posture would-be longs from a risk/reward perspective for a fresh leg higher. But we will first need to see how things play out here before considering anything further.
Dow Jones Daily Chart (could use a rest)
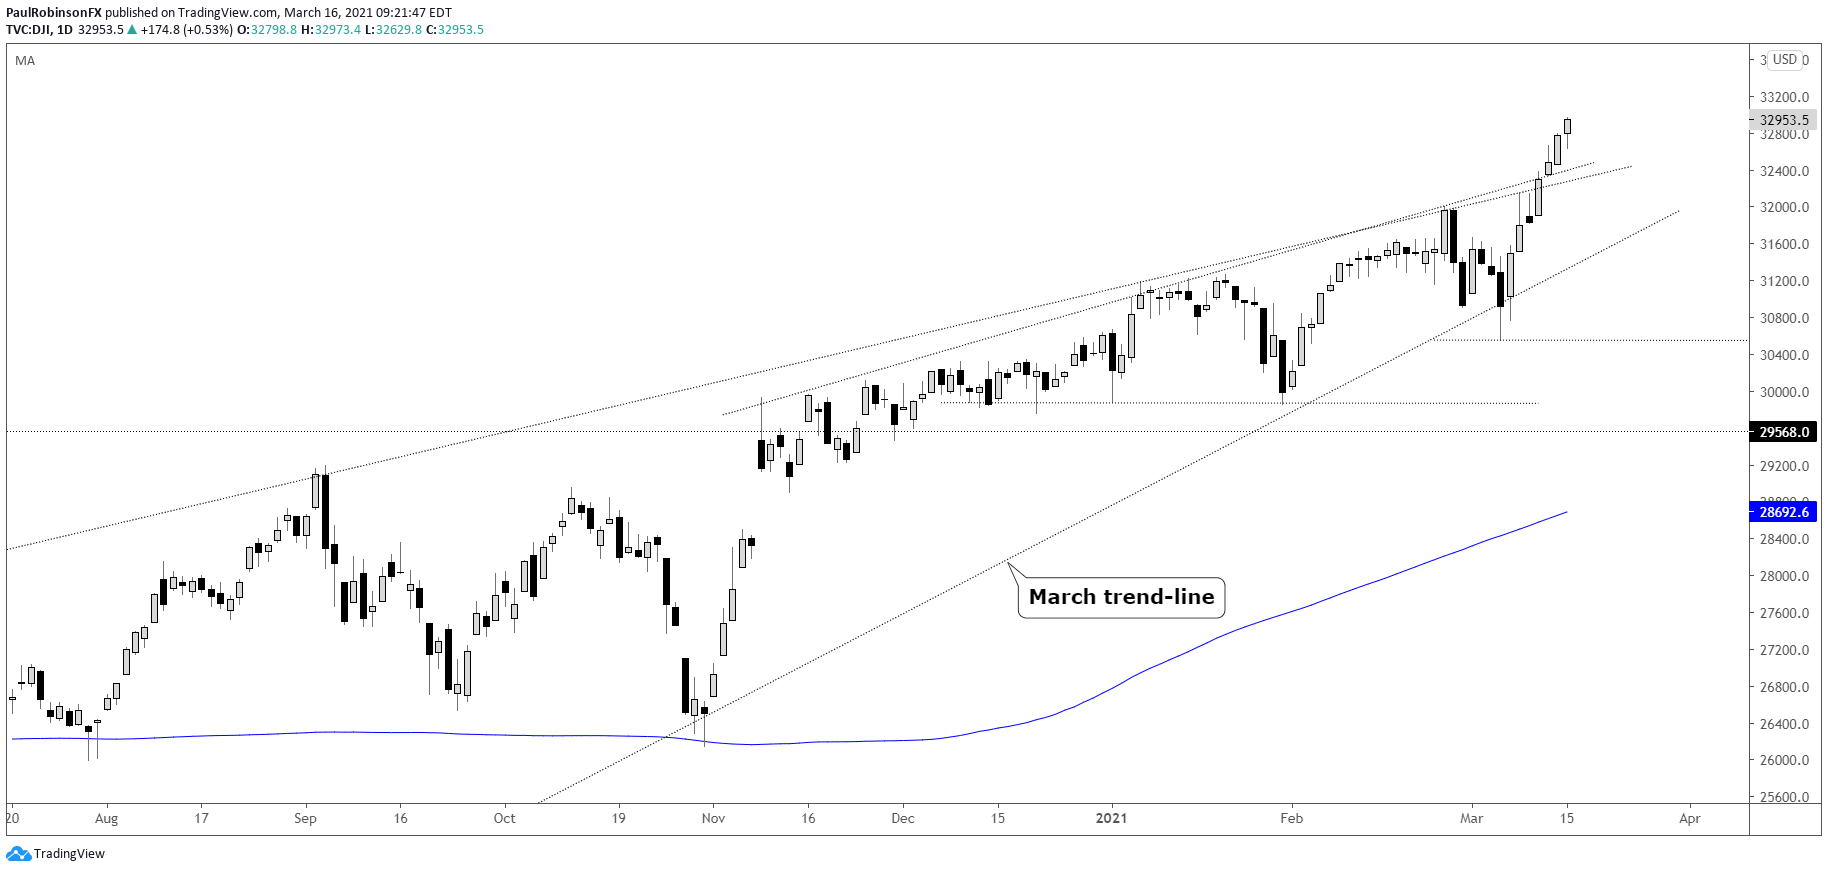
Dow Jones Chart by TradingView
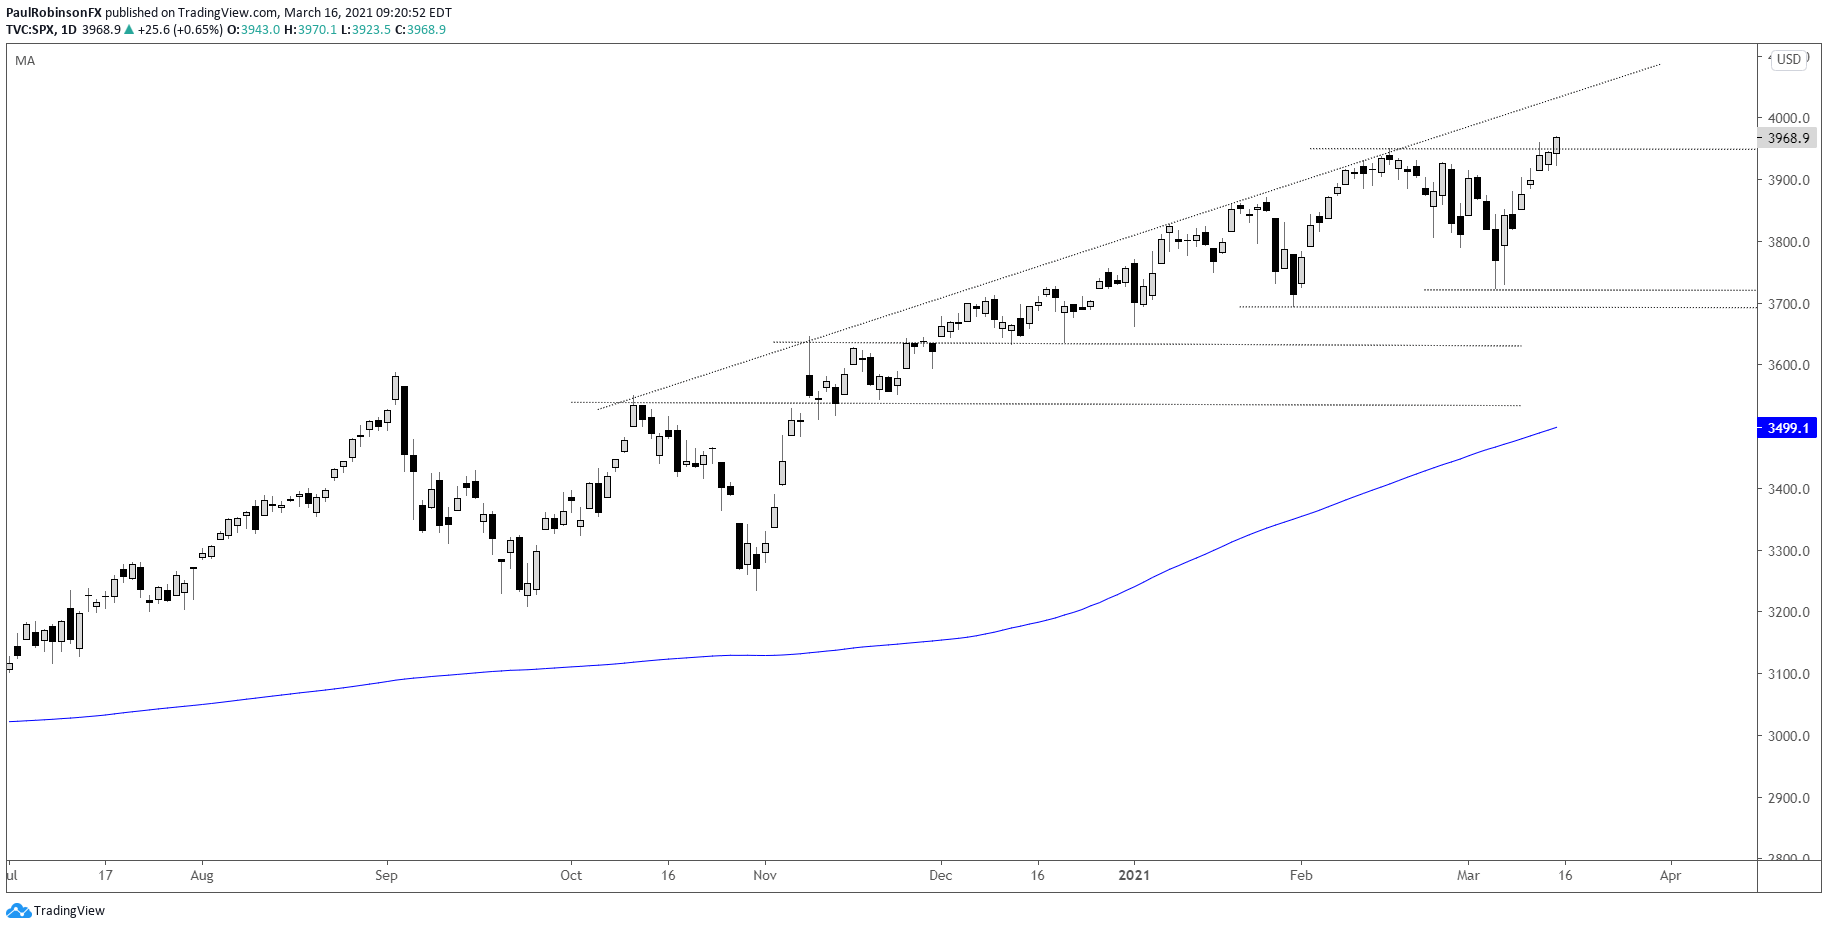
The S&P 500 took out its previous high at 3950 to break into record territory once again. The psych level of 4k lies just ahead. A consolidation period in new record territory could do the index some good before attempting to tack on further gains. Resting around the old high would signal good strength and a willingness by buyers to keep the index afloat after a solid run.
S&P 500 Daily Chart (fresh record highs)
The Nasdaq 100 was headed for a breakdown as it was trading under the March trend-line and neckline of a head-and-shoulders pattern. The sell-off was halted as general risk appetite firmed up. From here the NDX looks poised to hold, but the relative weakness demonstrated by the previous market leader could indicate that under the hood the broader market is beginning to weaken.
Overall, though, the trend is up for now and even though the tech-heavy NDX is out of favor with the rotation into value stocks, it is likely to stay buoyed. Should we see risk-off start to set in, look for the NDX to be a leader on the downside.
Nasdaq 100 Daily Chart (buoyed but relatively weak)
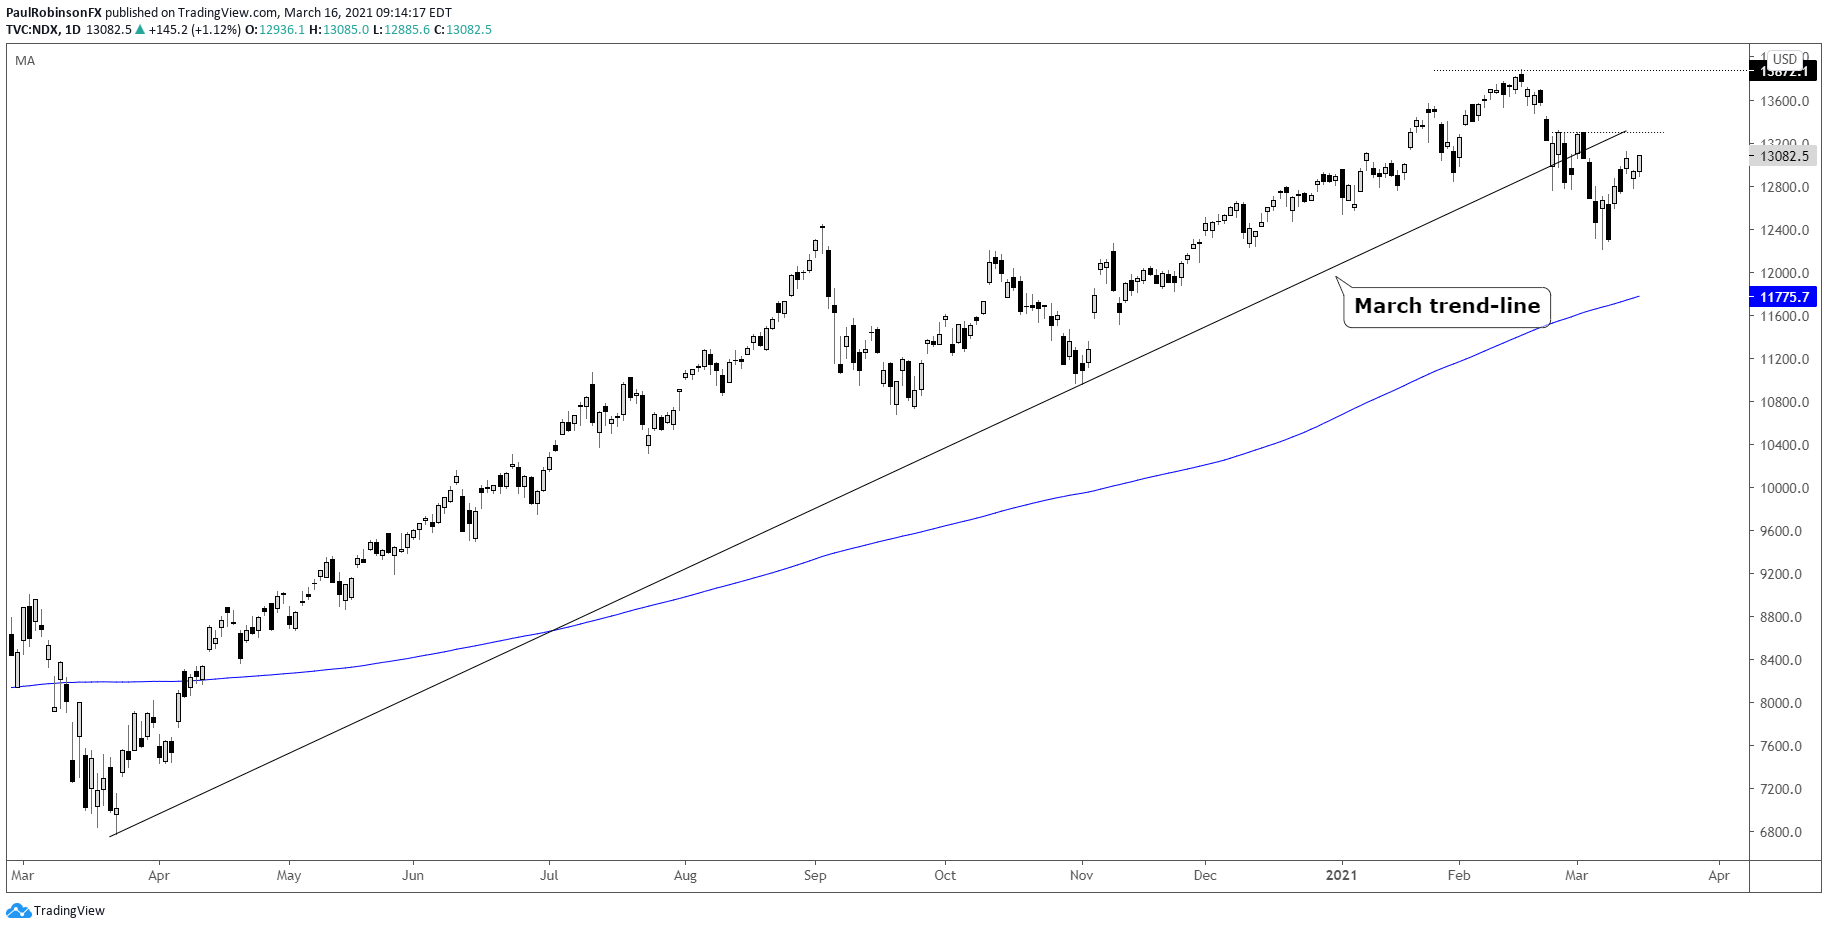
Nasdaq 100 Chart by TradingView
Resources for Forex Traders
Whether you are a new or experienced trader, we have several resources available to help you; indicator for tracking trader sentiment, quarterly trading forecasts, analytical and educational webinars held daily, trading guides to help you improve trading performance, and one specifically for those who are new to forex.
---Written by Paul Robinson, Market Analyst
You can follow Paul on Twitter at @PaulRobinsonFX


