


U.S. Indices Technical Outlook:
- S&P 500 bouncing but is it sustainable?
- Dow Jones holding the 200-day for now
- Nasdaq 100 supported by December trend-line
See how the quarterly forecast has played out what it could mean for the big-picture – Q3 Equity Markets Forecast.
S&P 500 bouncing but is it sustainable?
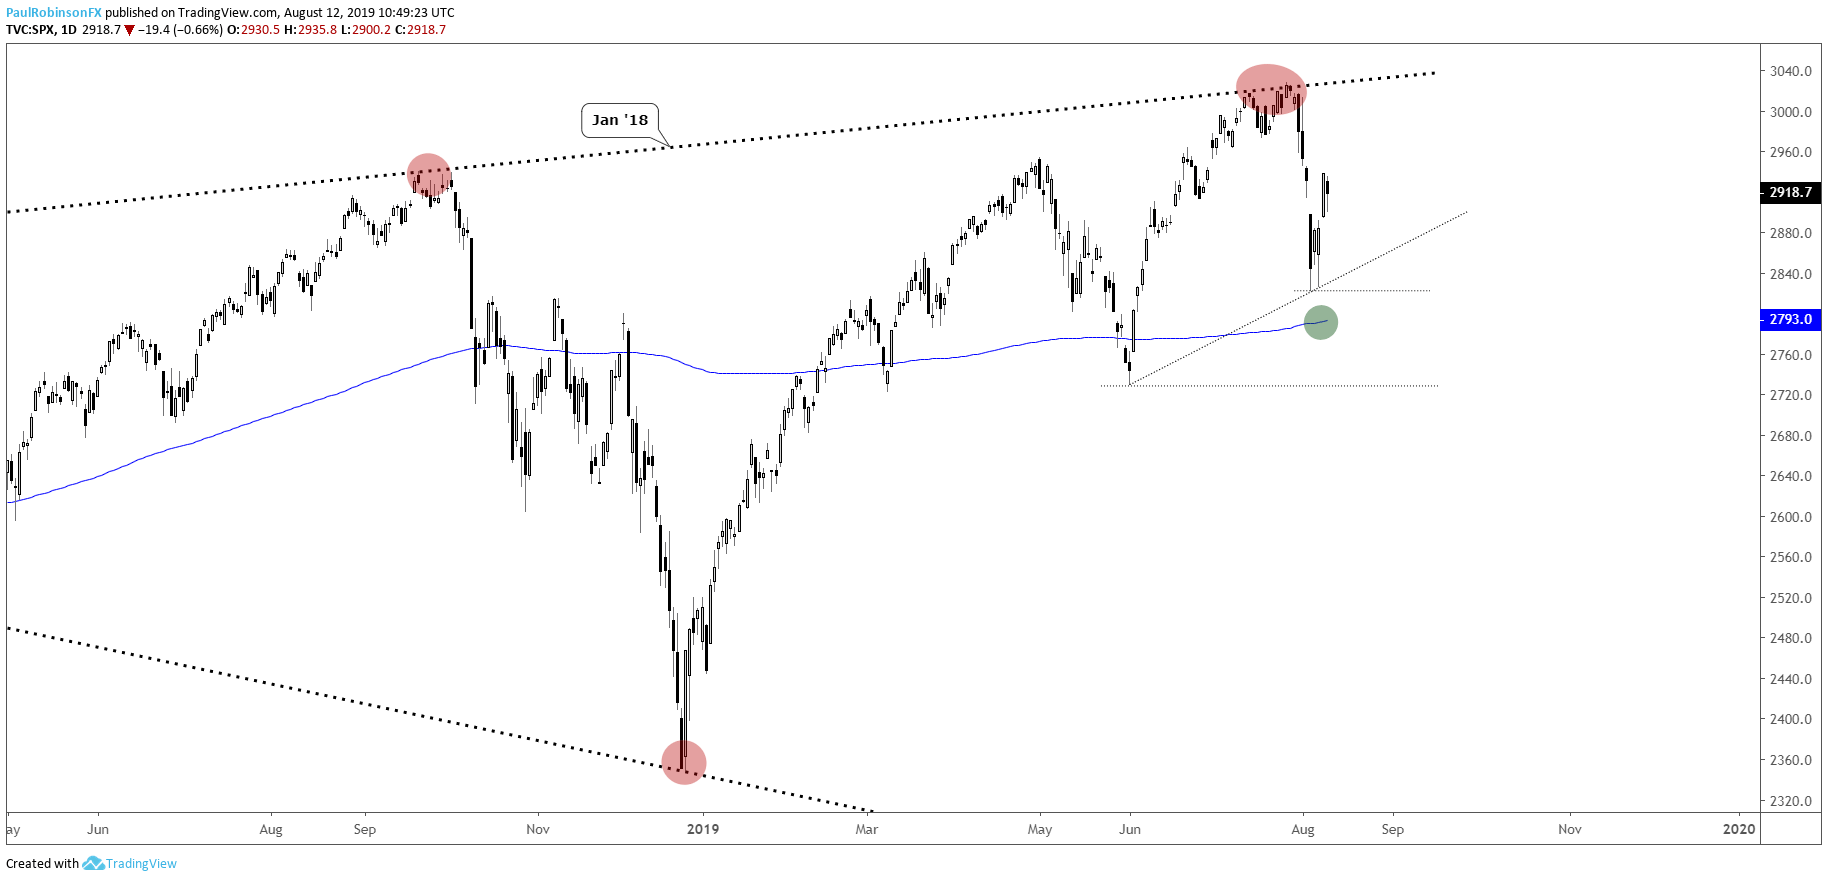
The S&P 500 found buyers before tagging any meaningful support, the 200-day looked to be in scope but wasn’t quite reached. So far, the bounce has held a decent amount of upward momentum, however; that doesn’t mean it will last for much longer.
If price starts to roll lower taking back a sizable chunk of the bounce, we may see downside momentum soon begin to pick up again. In the event the late week rise is only a bounce, then a break of 2822 will have the 200-day at 2793 in focus followed by the June low at 2728.
Further strength will have the 3k+ area in focus and top-side trend-line from January 2018. From there another round of weakness may be in store. Tactically speaking, from this seat, risk/reward for fresh positions is lacking at the moment from either side.
Check out the IG Client Sentiment page to see how retail traders are positioned and what it could potentially mean for various currencies and markets moving forward.
S&P 500 Daily Chart (solid bounce, so far)
Dow Jones holding the 200-day for now
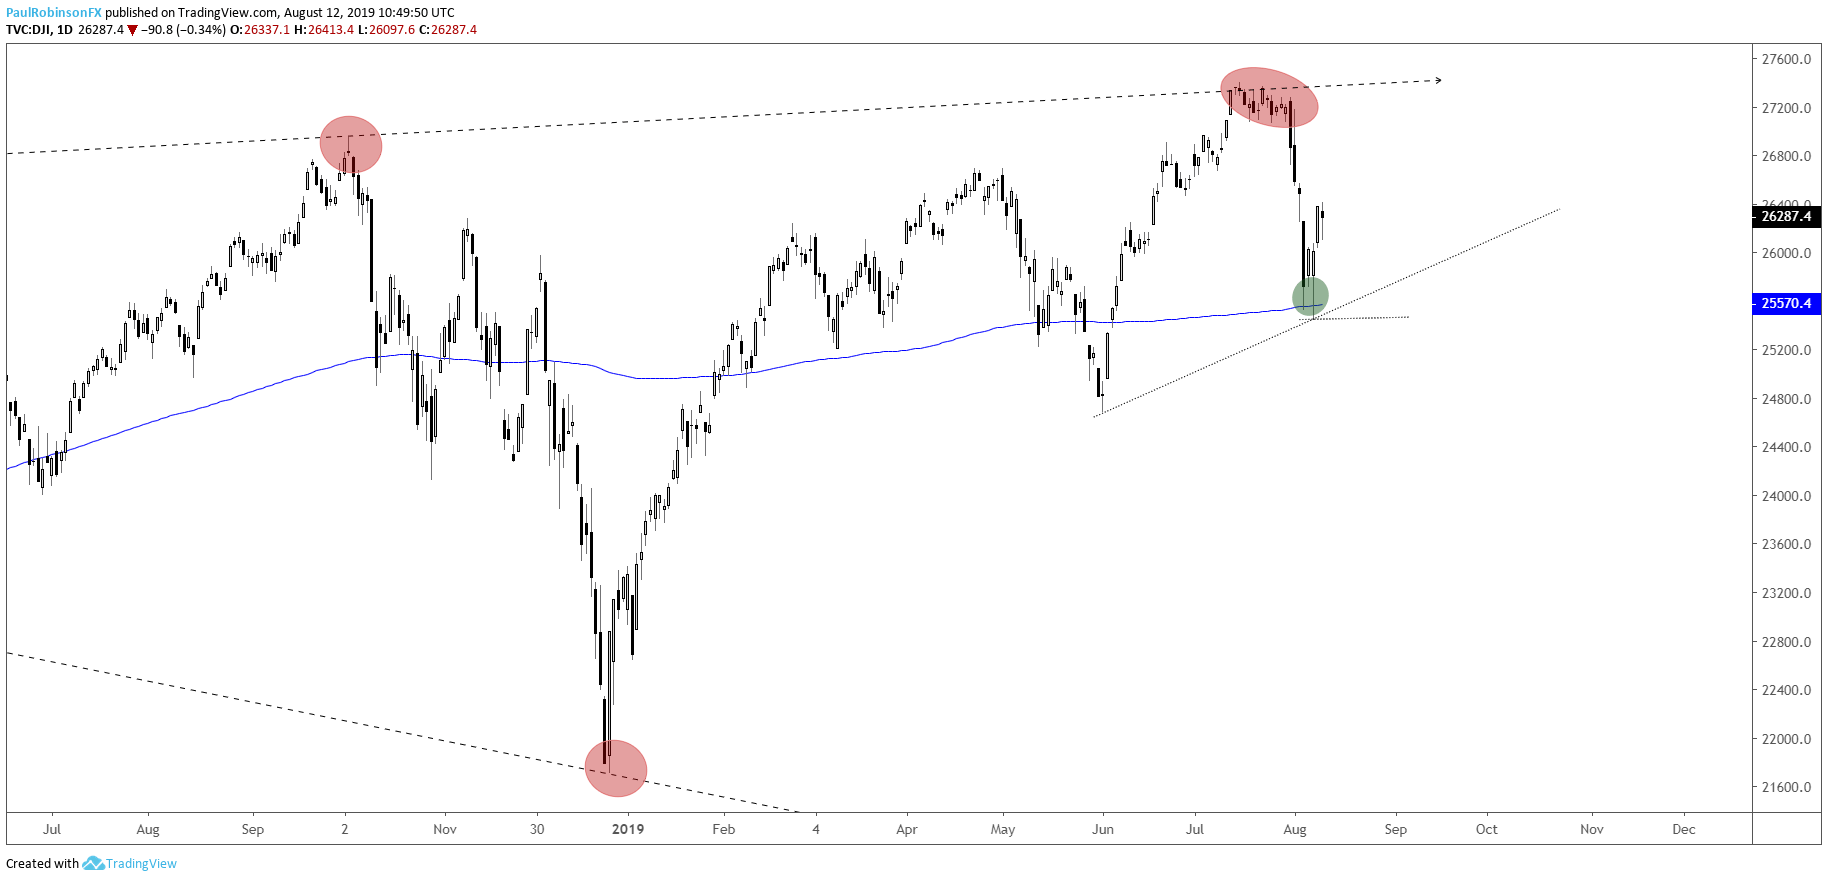
The Dow solidly probed the widely-watched 200-day MA and quickly rejected it. A breakdown from here and drop below 25440 will have the MA broken, with 24680 in watch at that point. A continued hold and strength off the 200 won’t have the Dow finding any substantial resistance up until around the old record high that resides above 27300. But that doesn’t mean it won’t stall ahead of time…
Dow Jones Daily Chart (200-day floor)
Dow Jones Chart by Tradingview
Nasdaq 100 supported by December trend-line
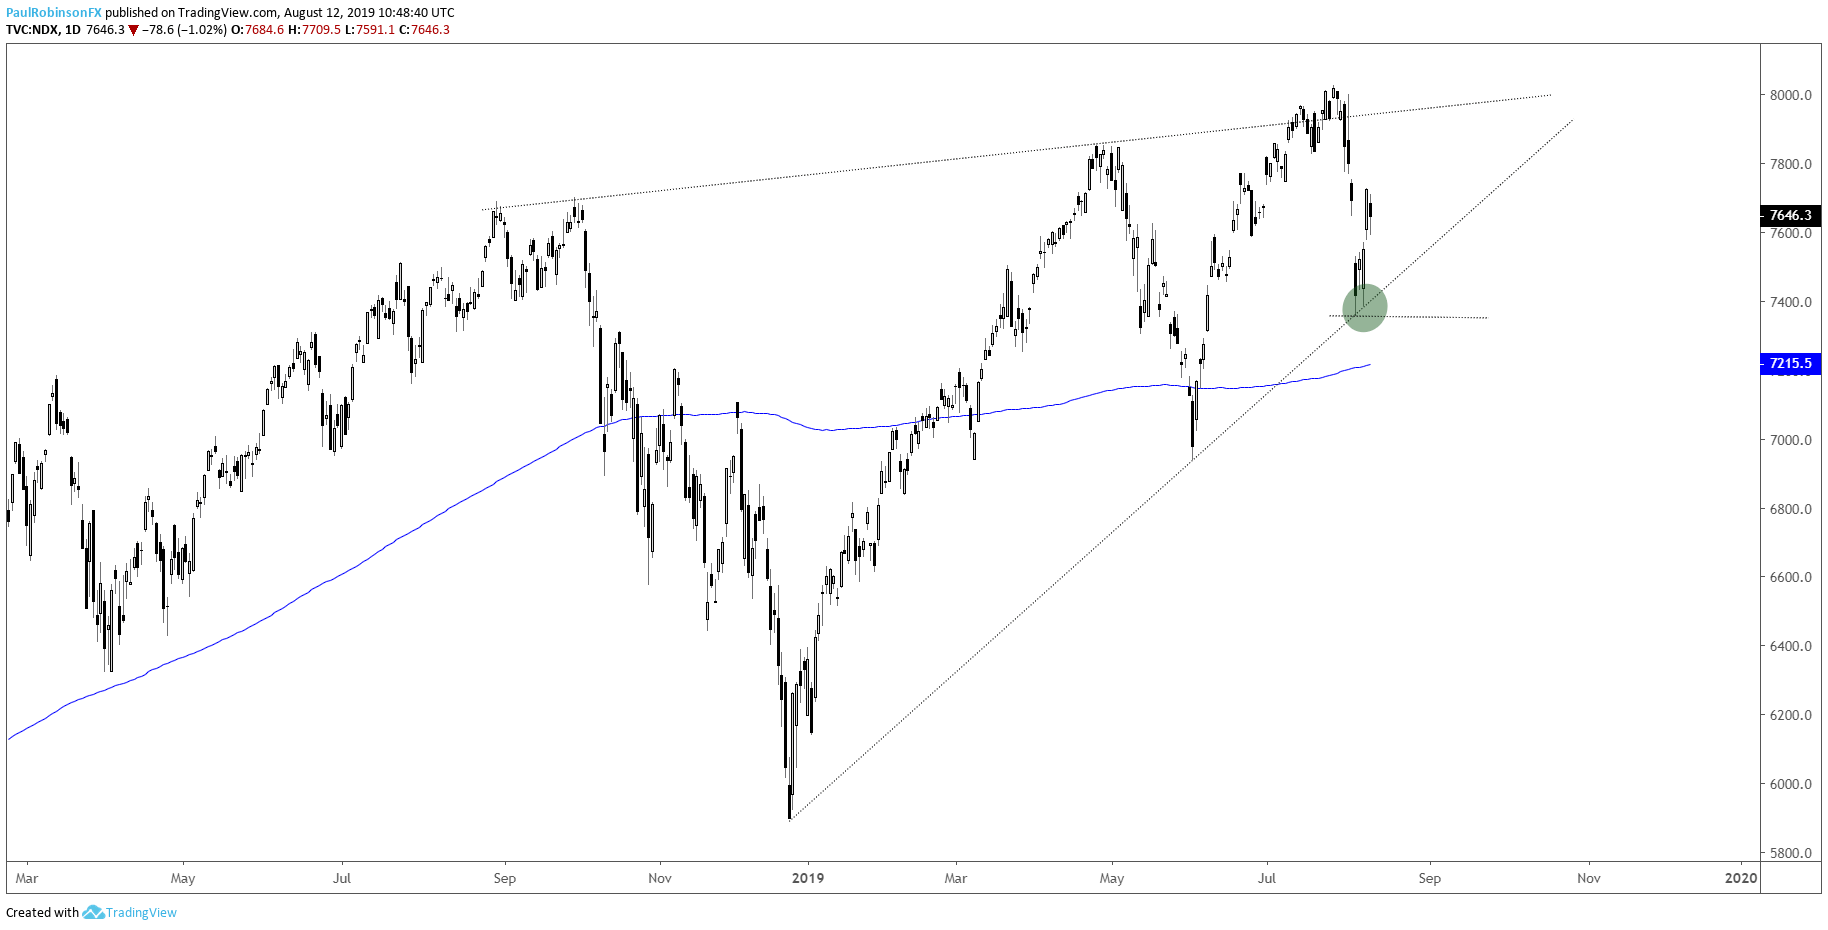
The Nasdaq 100 never broke the December trend-line, which will be used as support along with 7356, the low on the trend-line. Beneath there the 200-day at 7215 (& climbing) will be in focus. More broadly speaking the NDX has been building a wedge since September.
Given its upward slope and where we are in the longer-term trend, it could lead to a major top and drop. A firm break of the December trend-line would be the ‘official’ signal. If indeed the pattern triggers it could happen now or with a bit more wedging into September. More on that to be discussed should we soon see that happen.
Nasdaq 100 Daily Chart (Dec t-line in place for support)
Nasdaq 100 Chart by Tradingview
To learn more about U.S. indices, check out “The Difference between Dow, Nasdaq, and S&P 500: Major Facts & Opportunities.” You can join me every Wednesday at 10 GMT for live analysis on equity indices and commodities, and for the remaining roster of live events, check out the webinar calendar.
Tools for Forex & CFD Traders
Whether you are a beginning or experienced trader, DailyFX has several resources available to help you; indicator for tracking trader sentiment, quarterly trading forecasts, analytical and educational webinars held daily, trading guides to help you improve trading performance, and one specifically for those who are new to forex.
---Written by Paul Robinson, Market Analyst
You can follow Paul on Twitter at @PaulRobinsonFX


