S&P 500/Dow Highlights:
- S&P 500 and Dow now both in record territory
- Market remains bullish as long as higher highs, lows remain
- Minor dips seen as potential buying opportunities
For longer-term trading ideas, Q3 forecasts, and a library of educational content, check out the DailyFX Trading Guides
S&P 500 and Dow now both in record territory
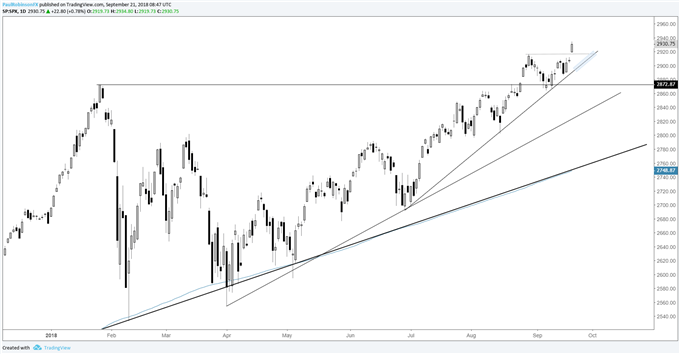
Both the S&P 500 and Dow are trading in record territory, leaving them without resistance. This gives the market room to run, but doesn’t necessarily leave traders with good risk/reward at this juncture. Equity markets are known to break to new highs only to dip before trading higher.
With that in mind, those who bought the last dip may want to implement a trailing stop of sorts to let profits run, but fresh longs may be best reserved for the next minor string of weakness or consolidation period.
Shorts have no appeal at this point outside of perhaps intra-day scalps, otherwise the time for being a steadfast seller will be best put off until the market shows real signs of wanting to trade lower. Bottom-line, as long as the trend-line from June acts as support the S&P is positioned to keep moving higher in the near-term. If it breaks, that may create a little room and momentum down to 2872 for selling.
S&P 500 Daily Chart

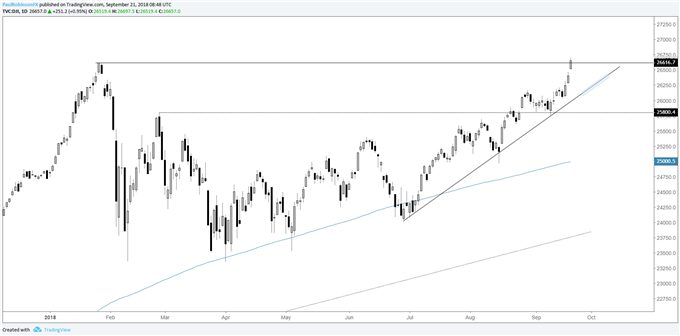
The Dow finally played catch-up and carved out a new record high from January, the last of the three major indices to do so. As is the case with the S&P this gives it room to go, but we also have to be mindful of the fact it just ran a good distance from the 25800-support level. Waiting for a pullback or consolidation period will help improve risk/reward on new long entries. Even if drops back below the old record high, as long as the trend-line from June holds the trend remains well intact.
Traders remain largely short the S&P 500, check out the IG Client Sentiment page to see how this acts as a contrarian indicator.
Dow Daily Chart

We just put together a piece recently highlighting the differences between the three major U.S. indices – ‘Difference Between Dow, Nasdaq, and S&P 500: Major Facts & Opportunities.’. Check it out to learn the varying characteristics one should know if you are going to trade them.
Resources for Forex & CFD Traders
Whether you are a new or experienced trader, we have several resources available to help you; indicator for tracking trader sentiment, quarterly trading forecasts, analytical and educational webinars held daily, trading guides to help you improve trading performance, and one specifically for those who are new to forex.
---Written by Paul Robinson, Market Analyst
You can follow Paul on Twitter at @PaulRobinsonFX


