


GBP/USD Price Technical Analysis
GBP/USD Price – Bears Hold Fire
On Feb 10, GBP/USD printed 1.2872- its lowest level in two and half months. However, the market rallied after as some bears seemed to cover. On Friday, the weekly candlestick closed in the green with 1.2% gain.
This week, the Relative Strength Index (RSI) fell from 48 to 40 indicating that downtrend move was gaining momentum.
GBP/USD DAILY PRICE CHART (Sep 15, 2018 – FEB 20, 2020) Zoomed out


GBP/USD DAILY PRICE CHART (Oct 16– FEb 20, 2020) Zoomed IN

From the daily chart, we noticed that last month GBP/USD stabilized and traded in a sideways move creating lower highs with higher lows. In early February, Cable leaned to the downside as closed below the 50-day average. The price failed twice to overtake 1.3048 generating another bearish signal.
Last week, the market repeated the same scenario and failed in multiple occasions to clear the aforementioned above level, indicating that bears were not done yet.
Yesterday, the pair moved to a lower trading zone 1.2774- 1.2965. Thus, a close below the low end of the zone may encourage bears to lead the price towards 1.2548. Further close below this level could mean more bearishness towards 1.2360. Having said that, the weekly support levels underlined on the chart (zoomed in) would be worth monitoring.
In turn, any failure in closing below the low end of the zone highlights bears reluctance. This could lead some of them to exit the market allowing GBPUSD to reverse towards the high end of the zone causing a sideways move. Its worth noting that, any bullish move requires clearing 1.3048 first.
th{{GUIDE|GBP|Download our fresh Q1 British Pound Forecast}}
GBP/USD Four Hour PRICE CHART (Jan 30 – FEB 20, 2020)
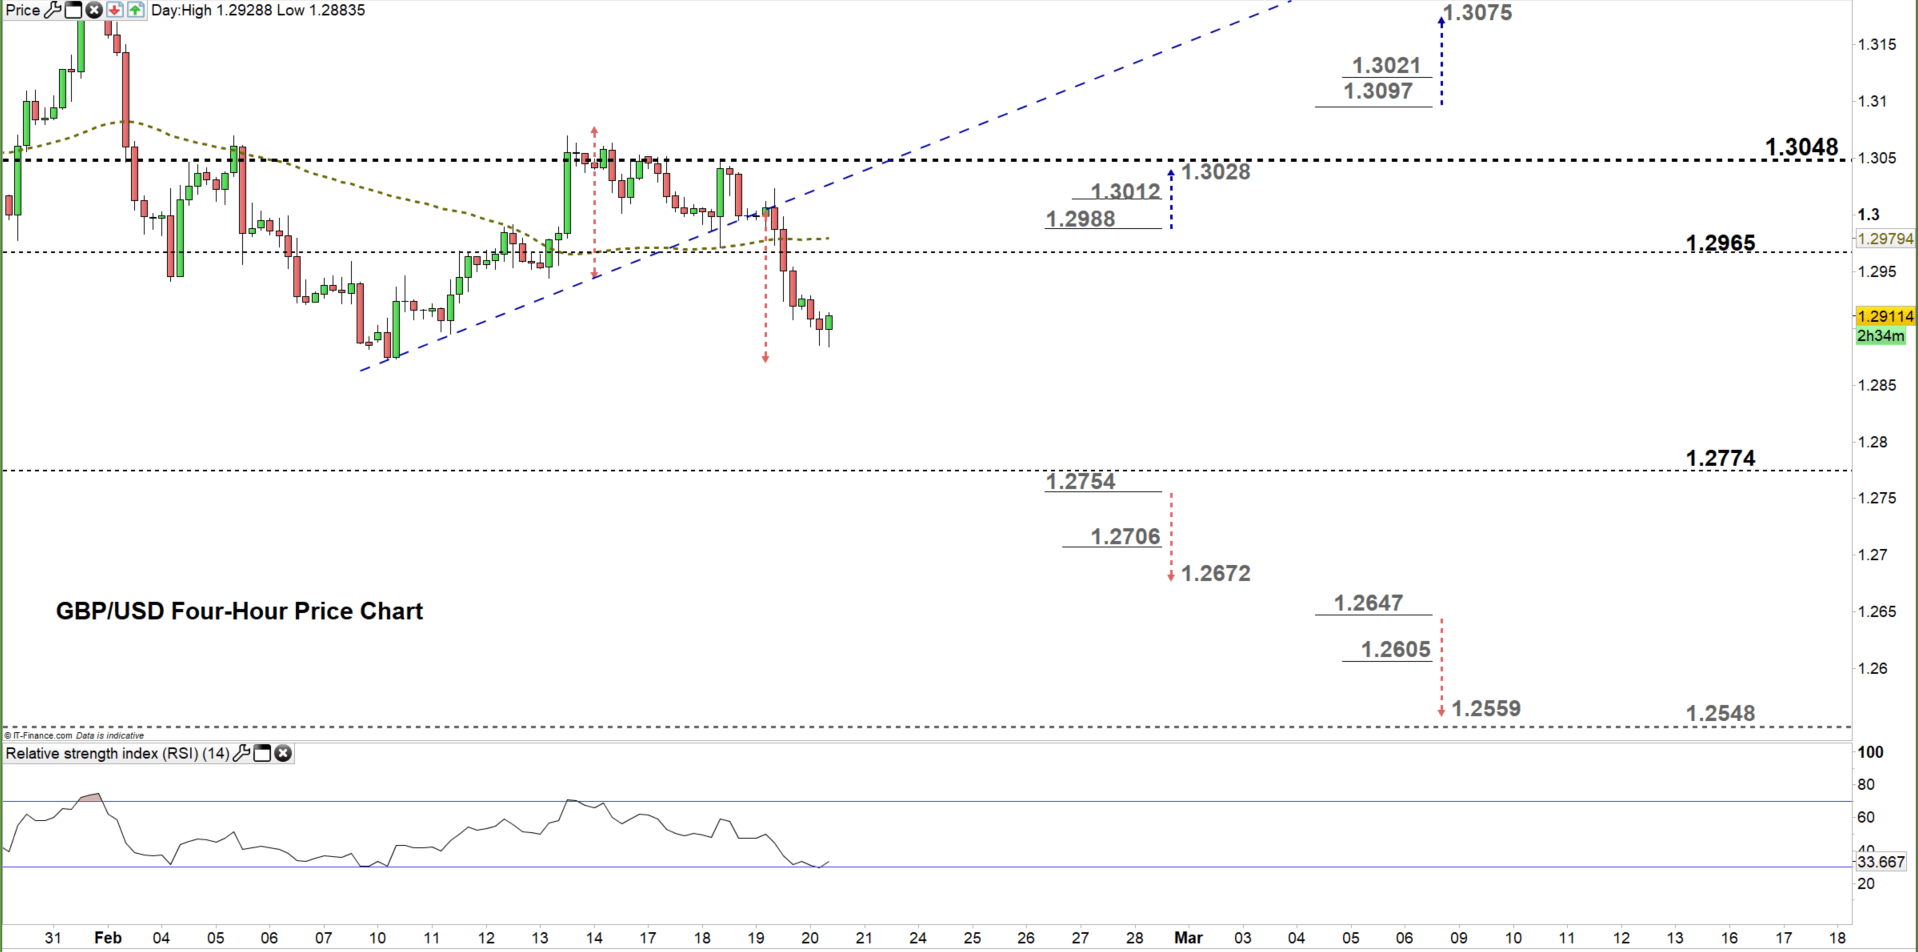
Looking at the four-hour chart, we notice that yesterday GBP/USD broke below the uptrend line originated form the Feb 10 low at 1.2772 , eyeing a test of the same low then the support area 1.2828-15.
Hence, a break below 1.2754 could send Cable towards 1.2672. Nevertheless, the weekly support level marked on the chart should be watched closely. On the other hand, a break above 1.2988 opens the door for a rally towards 1.3028. Although, the daily resistance level printed on the chart should be monitored.
See the chart to find out more about key levels Cable would encounter in a further bearish /bullish scenario.
Written By: Mahmoud Alkudsi
Please feel free to contact me on Twitter: @Malkudsi


