


GBP/JPY Pirce- Technical Outlook
- Risk-on sentiment sends GBP/JPY to a multi-month high
- GBP vs JPY price chart reveals a weaker upward trend
GBP/JPY - Bullish Market
On Friday, GBP/JPY took off to an over three-month high at 139.74 then closed the weekly candlestick in the green with a 4.2% gain. The Japanese yen lost value against major currencies due to a lower demand for safe havens caused by the optimism of a quicker economic recovery after many weeks of lockdown.
This week, the Relative Strength Index (RSI) has abandoned the overbought territory highlighting that bulls were losing momentum.
GBP/JPY Daily PRice CHART ( July 18, 2018 – June 10, 2020) Zoomed Out
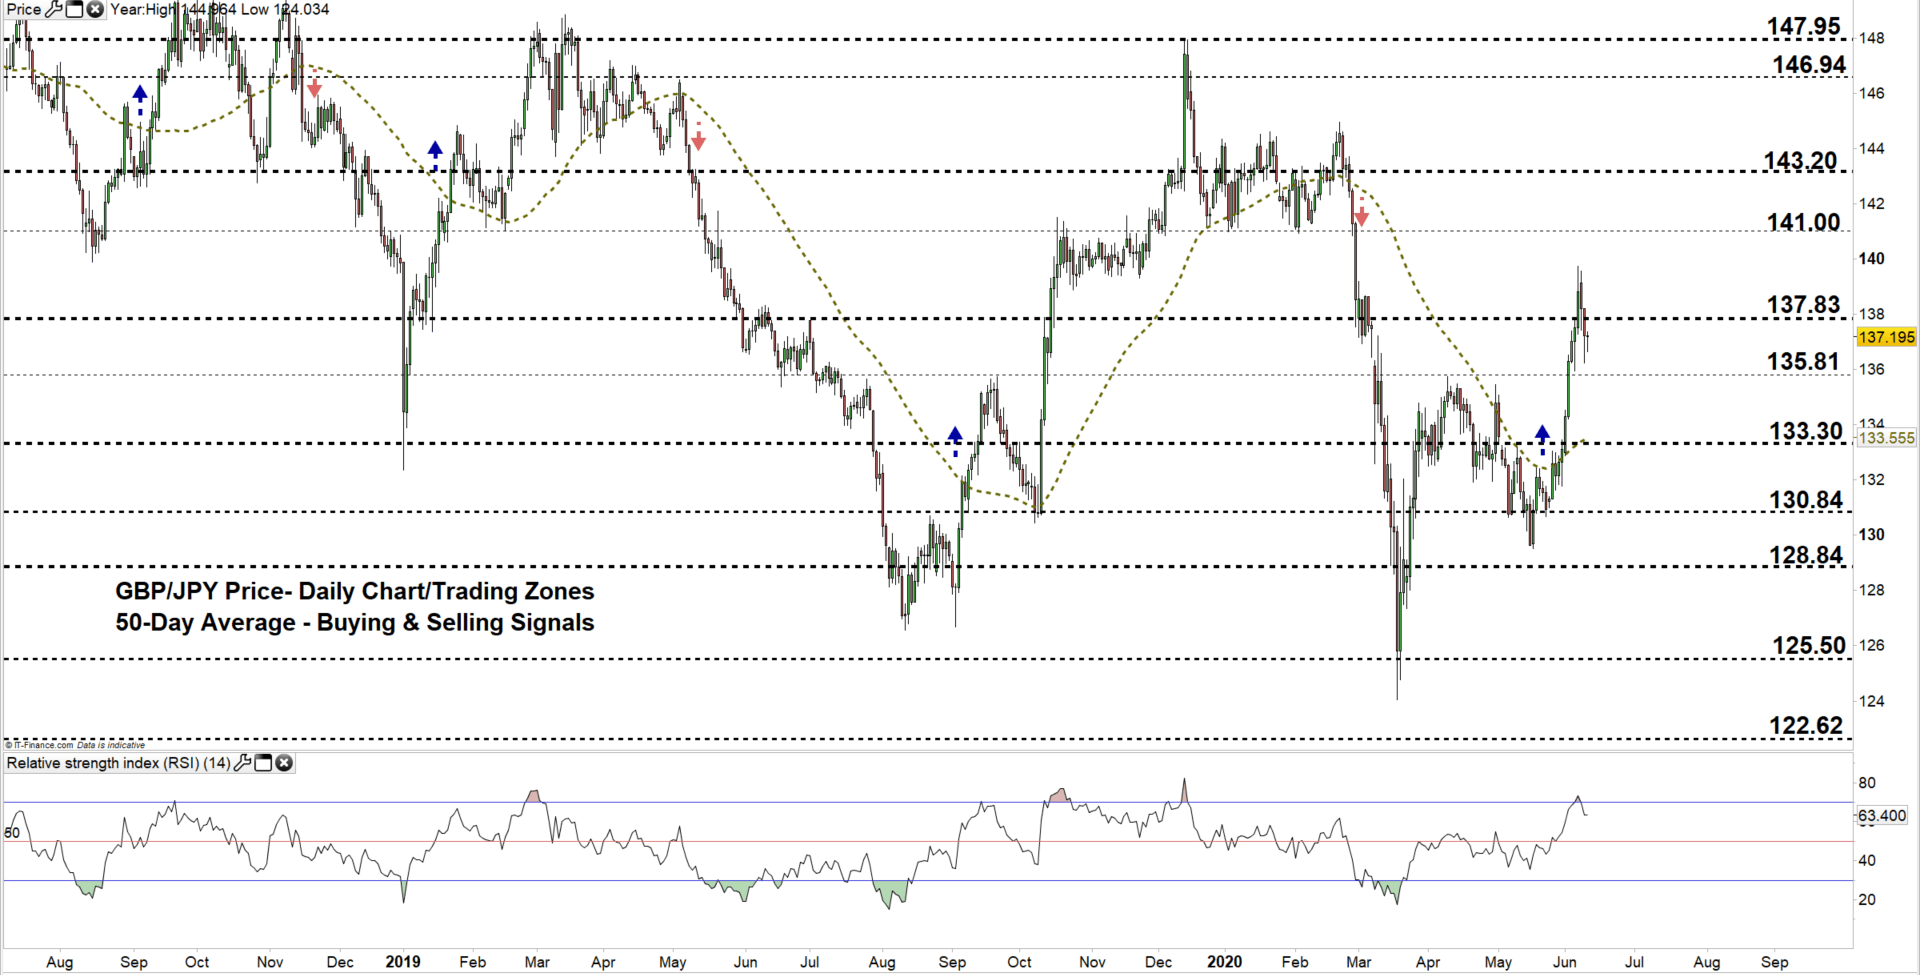

GBP/JPY Daily PRice CHART (March 26 – June 10, 2020) Zoomed In

On May 22, GBP/JPY corrected its downward trend and created a higher low at 131.78. A week later, the price closed above the 50-day moving average then rallied to a multi-month high. However, the pair has declined this week to the current trading zone 135.81 – 137.83 indicating a weaker bullish sentiment.
A close below the low end of the aforementioned zone reflects bull’s hesitation and could send GBPJPY towards 133.30. Any further close below that level could send the price even lower towards 130.84.
On the other hand, a close above the high end of the zone signals that bulls could push towards the 141.00 handle. Any further close above this level may extend the rally towards 143.20.
See the daily chart (zoomed in) to know more about the key levels to monitor in both scenarios.

GBP/JPY Four Hour PRice CHART (April 29 – June 10, 2020)
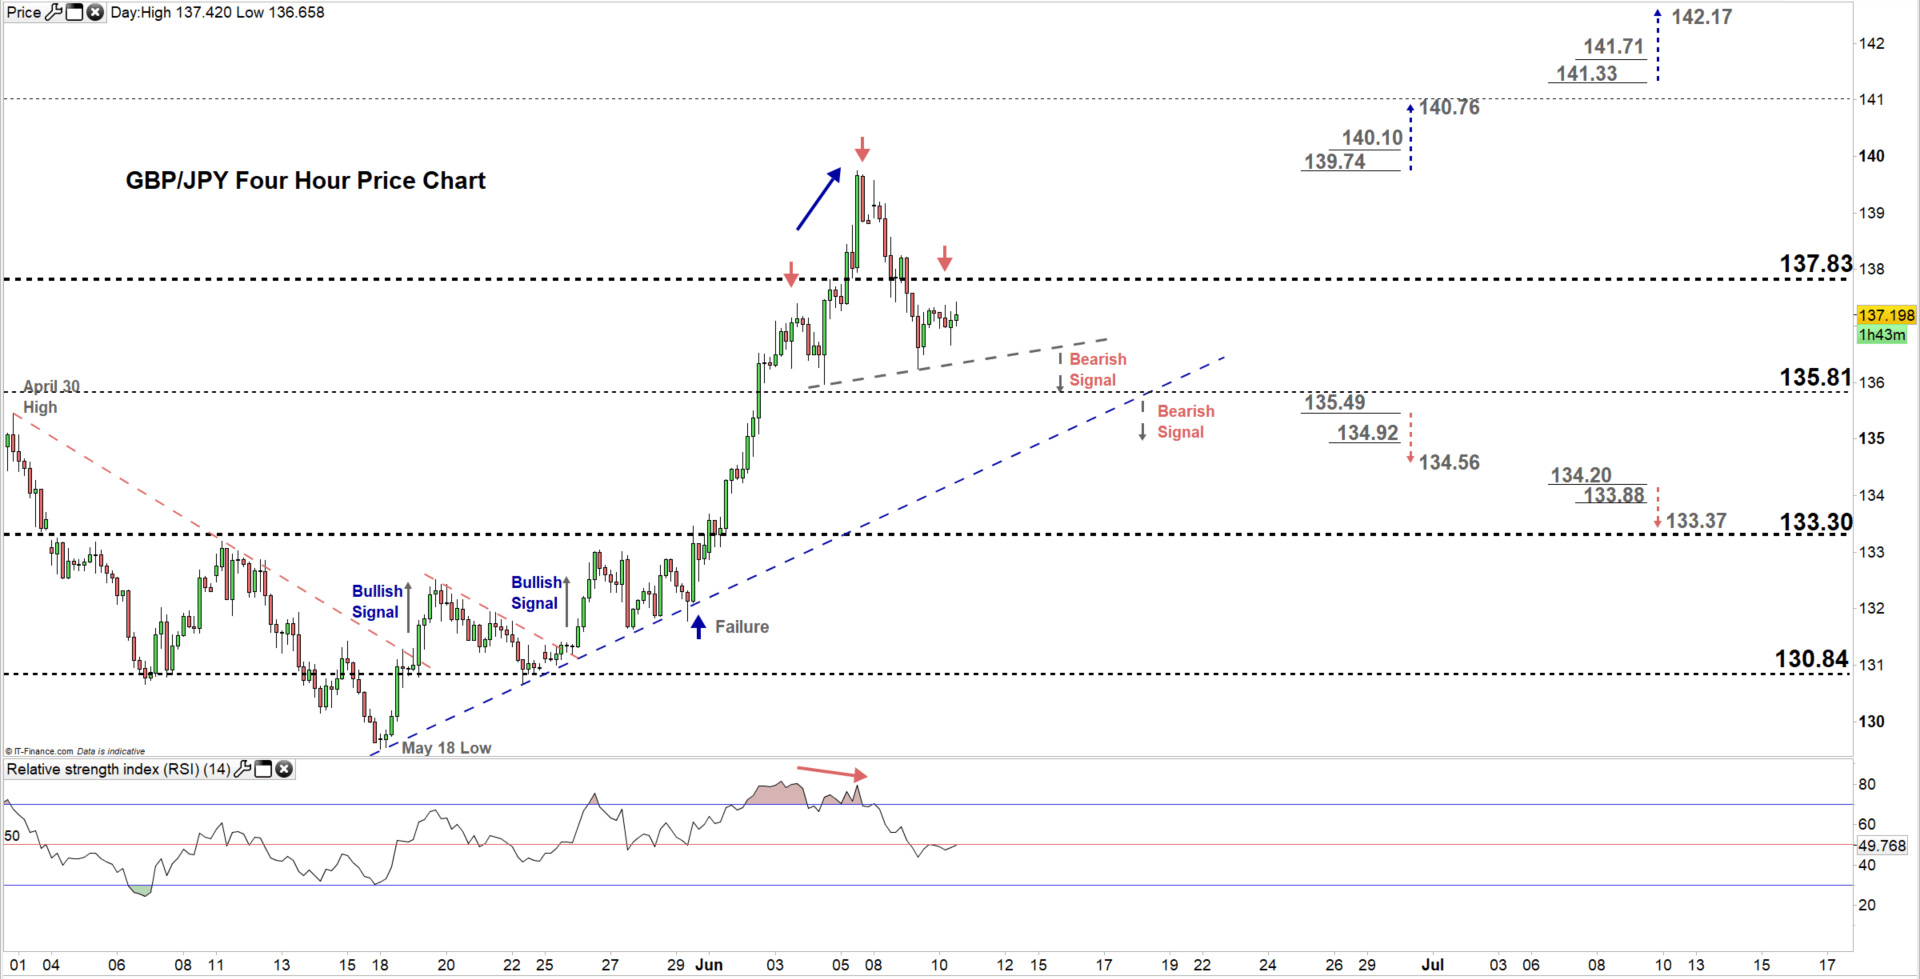
Yesterday, GBP/JPY rebounded and created the second shoulder of a head and shoulders pattern marked on the chart therefore, a break below the neckline located at 136.30 would be considered a bearish signal. Additionally, a bearish divergence between the price and the RSI has been noticed with the first creating a high with a higher high meanwhile, the latter created a high with a lower high highlighting a possible reversal of the upward trend.
Thus, a break below 135.49 could send GBPJPY towards 134.56 while a break above 139.74 may trigger a rally towards 140.76. Nonetheless, the daily and support and resistance underlined on the four-hour chart should be kept in focus.

Written By: Mahmoud Alkudsi, Market analyst
Please feel free to contact me on Twitter: @Malkudsi


