


EUR/USD TECHNICAL ANALYSIS: BEARISH
- Euro chart setup muddied anew as prices return above 1.11 figure
- Rise undid key support break, making for inconclusive chart setup
- Long-term technical positioning argues for a broadly bearish bias
See the latest Euro technical and fundamental forecast to find out what will drive prices in Q3!
Just when it seemed like a bit of clarity had finally emerged in Euro technical positioning, a sharp recovery from support above the 1.10 figure has muddied the waters anew. The move pointedly undid an earlier break below a long-standing support shelf in the 1.1107-16 area, which seemed to signal bearish trend resumption after a long period of aimless drift.
Prices are now pinned to neckline support-turned-resistance just above the 1.12 mark. A daily close above that faces minor upside barriers at 1.1286 and 1.1348 along the way to a challenge of the June 25 swing top at 1.1412. Alternatively, a move back below 1.1107 paves the way for another probe of the August 1 bottom (and two-year low) at 1.1027.
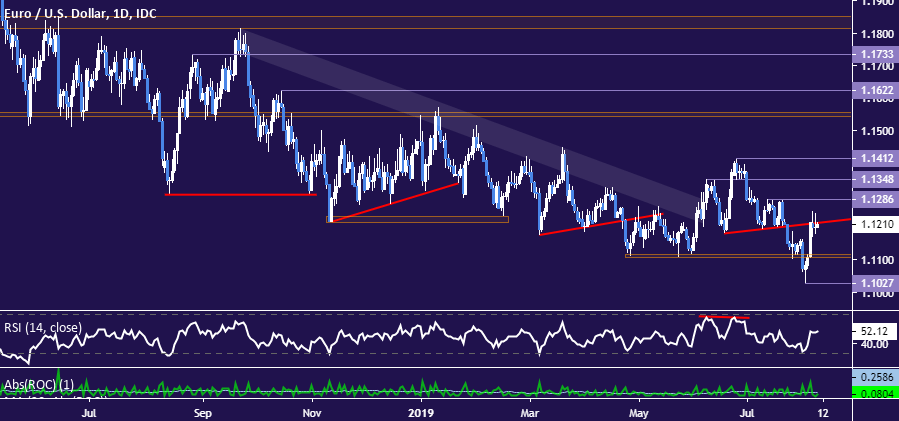
Daily EUR/USD chart created in TradingView
With near-term positioning looking conflicted once again, reviewing the overall trend bias is useful. The monthly chart points to a broadly bearish bias, with resumption of a more than decade-long EUR/USD downtrend making steady (if modest) headway after a break of support near 1.15 in October 2018. A break below the inflection point at 1.0980 could expose a range floor near 1.05.

Monthly EUR/USD chart created in TradingView
EUR/USD TRADING RESOURCES
- Just getting started? See our beginners’ guide for FX traders
- Having trouble with your strategy? Here’s the #1 mistake that traders make
- Join a free webinar and have your questions answered
--- Written by Ilya Spivak, Currency Strategist for DailyFX.com
To contact Ilya, use the comments section below or @IlyaSpivak on Twitter


