


Talking Points:
- The ASX 200 looks relaxed above 6000
- But it remains overbought, despite recent consolidation
- Still, there’s plenty of likely support nearby
Join our analysts for live coverage of all major Australian economic data at the DailyFX Webinars
The ASX 200 has broken above the uptrend channel which contained trade between early April and early May. However, its rise seems to have faltered tantalizingly below the ten-year highs briefly scaled in January at 6149 or so.
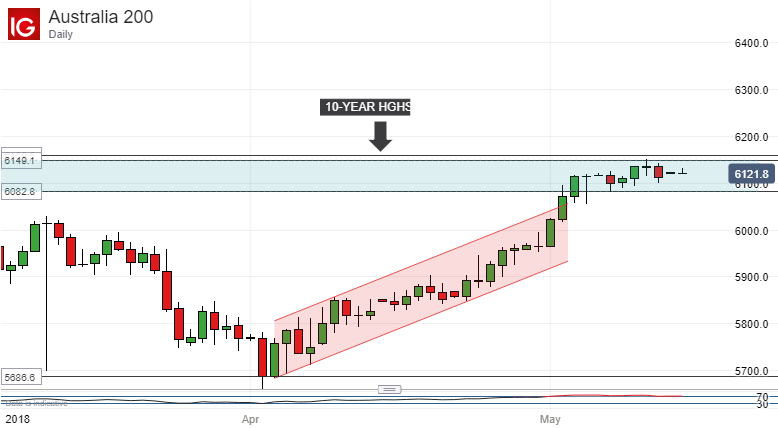
Bulls will no doubt take some encouragement from the fact that investors remain happy to hold the index even at these rarified levels .There’s been little sign of overt cashing out and, with the index over the psychologically crucial 6,000 level that in itself is probably a sign of strength.
6000 has long been the point at which rallies falter.
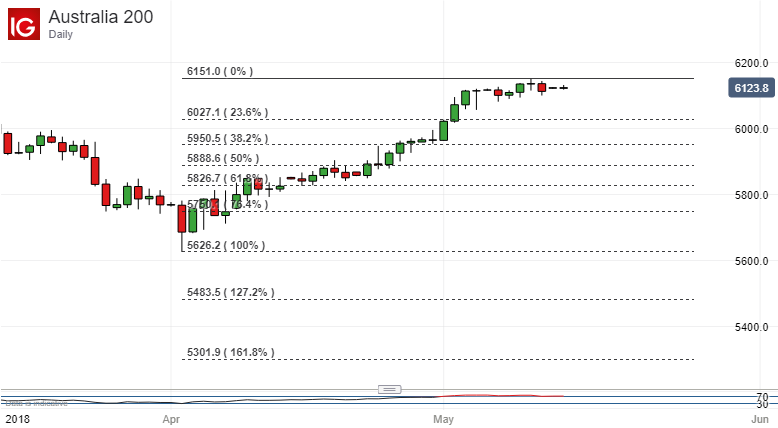
It does seem a little happier above that point at the moment though. The current consolidation- and that’s what it looks like- hasn’t even taken the Sydney stock benchmark close to 6027.1. That would be the first, 23.6% Fibonacci retracement of the rise from April’s lows to current peaks.
However, despite this apparent composure the ASX 200 still looks quite heavily overbought, even after the past couple of weeks’ lack of major moves. Its Relative Strength Index is still at 73, clearly above the 70 point, which usually sets alarm bells ringing.
It is possible that the index needs to hold on a bit longer up here to let this overbuying settle down. Still, while it remains comfortable so far above that support, there’s no clear reason to go short of this index and those currently long should probably wait now to see if the current consolidation can send the index back to new ten-year highs.
Resources for Traders
Whether you’re new to trading or an old hand DailyFX has plenty of resources to help you. There’s our trading sentiment indicator which shows you live how IG clients are positioned right now. We also hold educational and analytical webinars and offer trading guides, with one specifically aimed at those new to foreign exchange markets. There’s also a Bitcoin guide. Be sure to make the most of them all. They were written by our seasoned trading experts and they’re all free.
--- Written by David Cottle, DailyFX Research
Follow David on Twitter @DavidCottleFX or use the Comments section below to get in touch!


