Skip to Content
News & Analysis at your fingertips.

We use a range of cookies to give you the best possible browsing experience. By continuing to use this website, you agree to our use of cookies.
You can learn more about our cookie policy here, or by following the link at the bottom of any page on our site. See our updated Privacy Policy here.

Free Trading Guides
Subscribe
Please try again
Select

Live Webinar Events

0

Economic Calendar Events

0

Notify me about

Live Webinar Events
Economic Calendar Events

H

High

M

Medium

L

Low
More View More
Breaking news

US Core PCE y/y unchanged at 2.8% vs. 2.6% expectations

Breaking news

PCE Price Index y/y at 2.7% vs. 2.5% prior and 2.6% expectations

Crude Oil Tests 2016 Trendline before Inventories

Crude Oil Tests 2016 Trendline before Inventories

Jamie Saettele, CMT, Sr. Technical Strategist

Share:

Daily

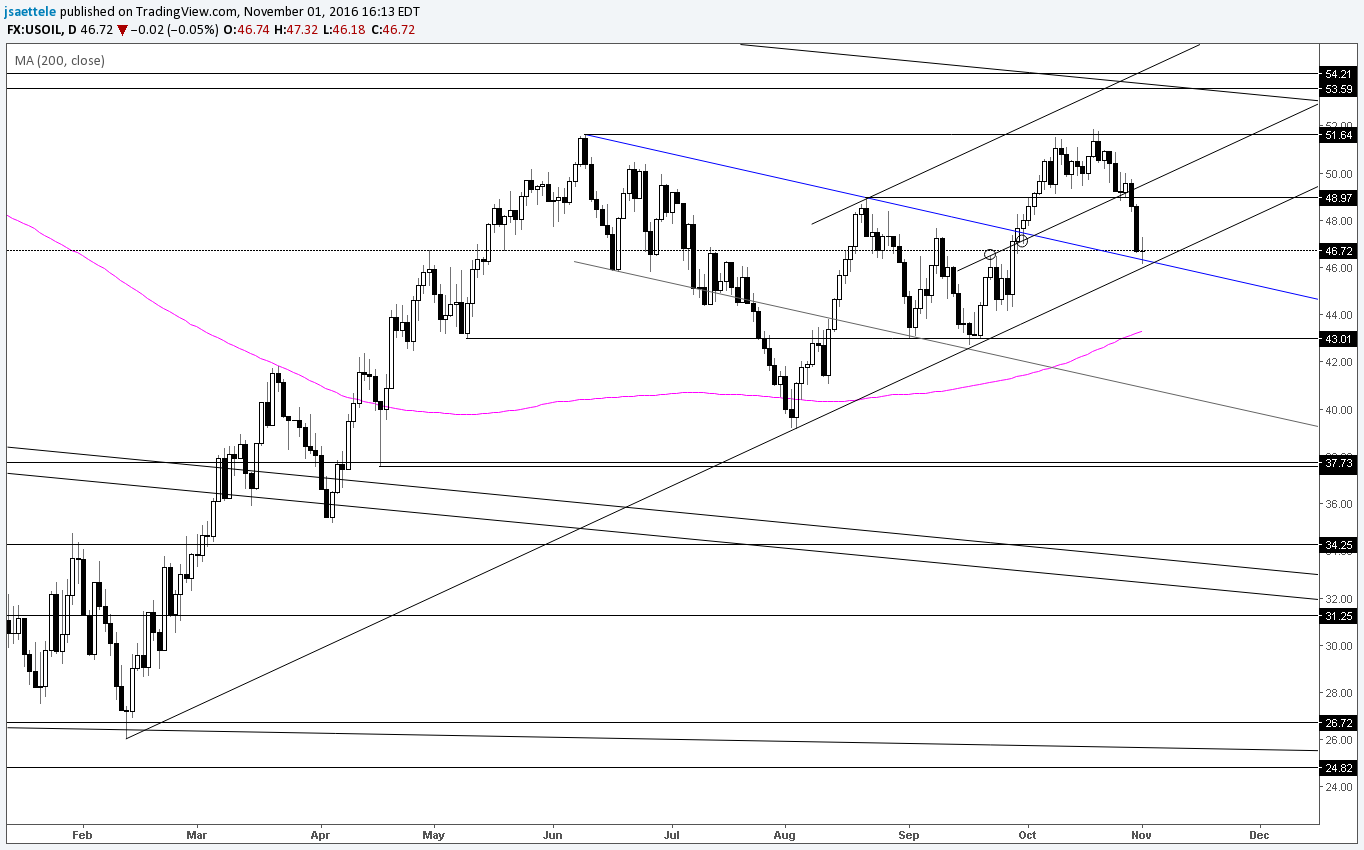
Chart Prepared by Jamie Saettele, CMT

DailyFX Trading Guides and Forecasts

-“The possible yearlong head and shoulders pattern (lows in August 2015, February 2016 and August 2016) is intriguing but crude just printed a YTD high and pulled back sharply. Watch for support at 49 (former high) but failure to hold that level risks a drop into the former support line (in blue) near 46.” Crude is testing the mentioned level (46). The current level is huge as a break below would indicate a break of the 2016 uptrend (since February). The 200 day average and a former floor near 43 would be next in line from a trading standpoint.

DailyFX provides forex news and technical analysis on the trends that influence the global currency markets.

DISCLOSURES