Skip to Content
News & Analysis at your fingertips.

We use a range of cookies to give you the best possible browsing experience. By continuing to use this website, you agree to our use of cookies.
You can learn more about our cookie policy here, or by following the link at the bottom of any page on our site. See our updated Privacy Policy here.

Free Trading Guides
Subscribe
Please try again
Select

Live Webinar Events

0

Economic Calendar Events

0

Notify me about

Live Webinar Events
Economic Calendar Events

H

High

M

Medium

L

Low
More View More
EUR/USD Rally Fails at Election Day Close and 200 Day Average

EUR/USD Rally Fails at Election Day Close and 200 Day Average

Jamie Saettele, CMT, Sr. Technical Strategist

Share:

Daily

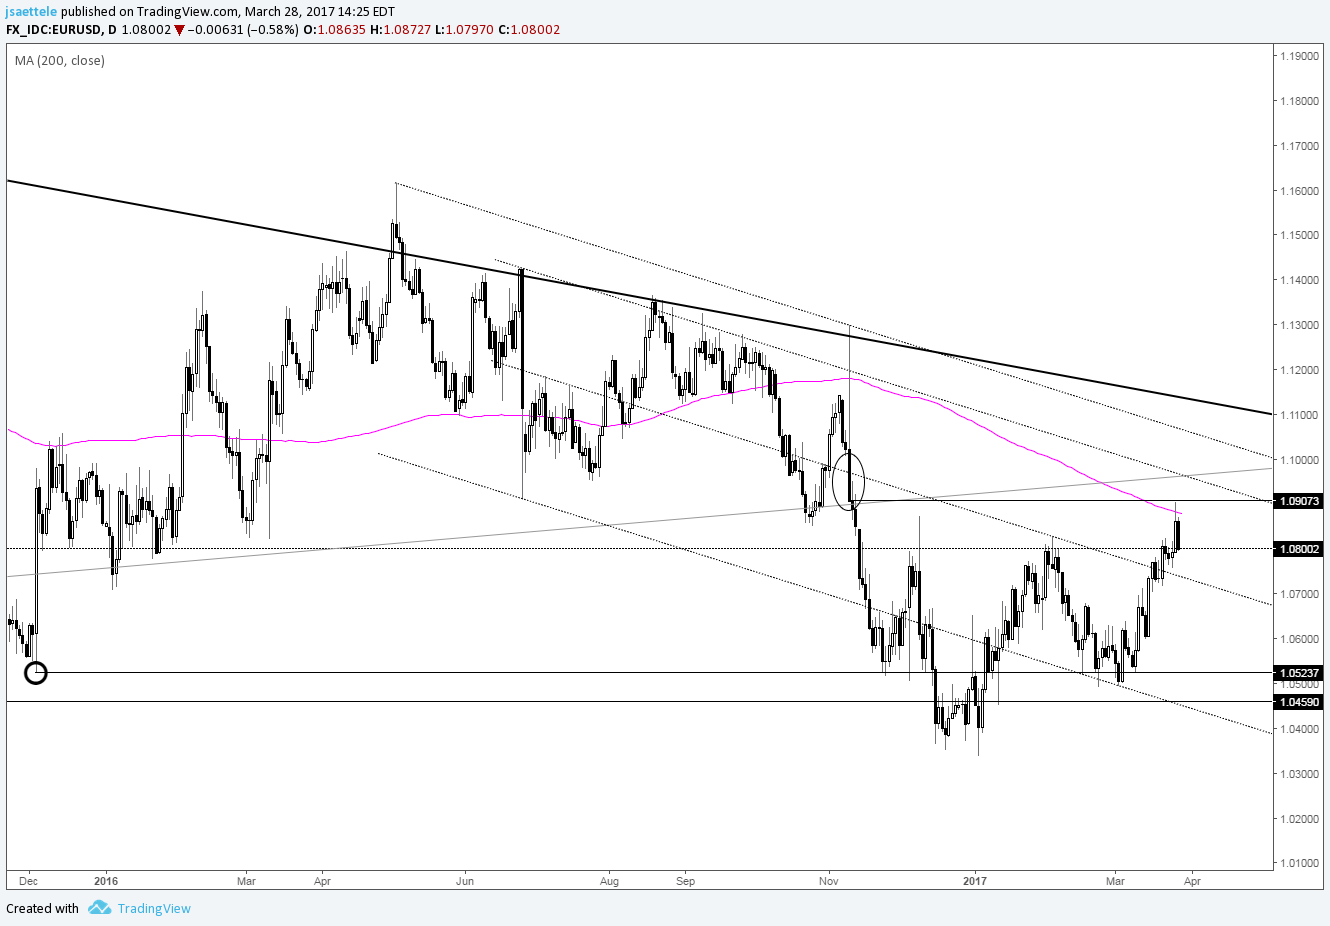
Chart Prepared by Jamie Saettele, CMT

DailyFX Trading Guides and Forecasts

Real Time Positioning

-Higher highs and higher lows are in place for 2017 in EUR/USD but the rate has failed at a big technical level. The level in question is the 200 day average and US Presidential Election Day close at 1.0909. The 1.0800/50 has been the bull/bear dividing line for several years too which makes a ‘call’ at the current level all the more difficult. As long as price is under the noted 1.0909, it’s difficult to be overly bullish. The 20 day average (not shown) remains a decent reference point as well. For a big wave count possibility, check out this video.

DailyFX provides forex news and technical analysis on the trends that influence the global currency markets.

DISCLOSURES