


British Pound, GBP/USD, US Dollar, AUD/GBP, Australian Dollar - Talking points
- GBP/USD has bounced off recent lows on a move to test resistance
- AUD/GBP has also rallied, as historical highs come into view
- With diverging paths for Sterling, what direction will dominant the Pound?
Trade Smarter - Sign up for the DailyFX Newsletter
Receive timely and compelling market commentary from the DailyFX team
GBP/USD TECHNICAL OUTLOOK
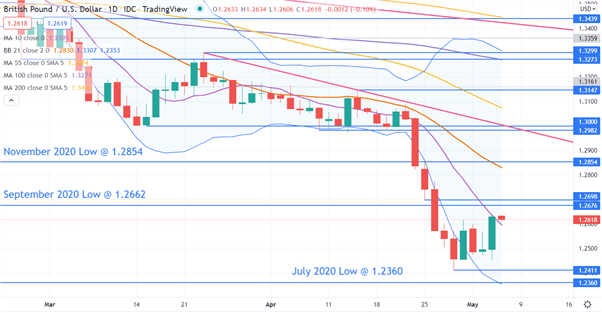
GBP/USD made a 2-year low at 1.2411 last week, not far from the July 2020 low of 1.2360. These two levels may provide support.
That move lower saw a breakout in volatility, as shown by the widening of the 21-day simple moving average (SMA) based Bollinger Band. The price moved outside the lower band but has since closed back inside the band, setting up a rally.
This move up has broken above the 10-day SMA, suggesting there could be a pause in short term bearish momentum.
It should be noted though that the 21-, 55-, 100- and 200-day SMAs remain above the price and exhibit negative gradients. This may indicate that underlying medium and long-term bearish momentum persists.
On the topside, potential resistance might be offered at the nearby pivot points of 1.2676, 1.2698 or further up at 1.2854, 1.2982 and 1.3000. The latter 2 levels also currently coincide with a descending trend line. The 21-day SMA may also offer resistance at 1.2830.
Introduction to Technical Analysis
Learn Technical Analysis
Recommended by Daniel McCarthy
AUD/GBP TECHNICAL ANALYSIS
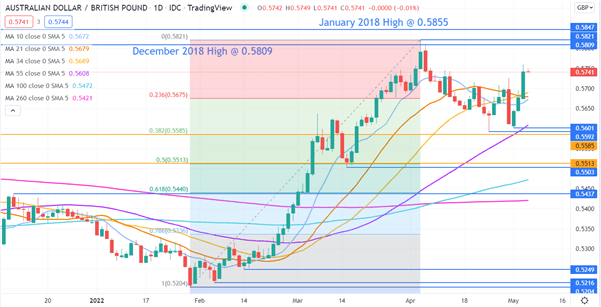
After making a 2-year low of 0.5204 in January, AUD/GBP made a 4-year high last month at 0.5821 and has since consolidated.
The 38.2% Fibonacci Retracement of this move lies at 0.5585. The two most recent lows of 0.5592 and 0.5601 were just above this retracement level and this could be a support zone.
The 55-day simple moving average (SMA) is currently just above this area at 0.5608, potentially lending further support.
Below there, the 50% Fibonacci Retracement of the move is at 0.5513, just above the mid-March low of 0.5503. This may also be a support zone.
On the topside, resistance could be at previous peaks of 0.5809, 0.5821 and 0.5847. A decisive break above the January 2018 high of 0.5847 could see momentum evolve to test the 2017 peaks above 0.6000.
The most recent rally has seen the price break above the near term 10-, 21- and 34-day SMAs, which could suggest that bullish momentum is resuming.
--- Written by Daniel McCarthy, Strategist for DailyFX.com
To contact Daniel, use the comments section below or @DanMcCathyFX on Twitter


