


Japanese Yen, USD/JPY, CHF/JPY - Talking Points
- USD/JPY leapt higher to kick off 2022 but the move lacked follow-through
- CHF/JPY also made a new peak, but it was unable to sustain the rally
- JPY appears to have short term momentum in its favour. Will the Yen strengthen?
Introduction to Technical Analysis
Learn Technical Analysis
Recommended by Daniel McCarthy
USD/JPY – Technical Analysis
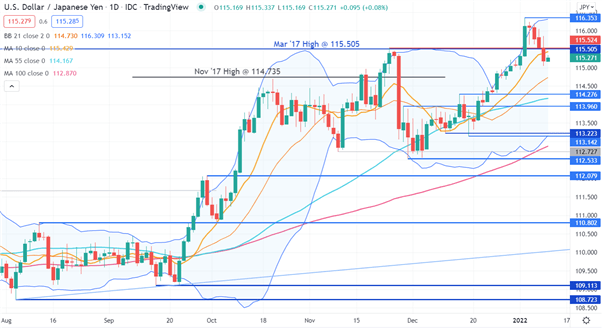
Last week, USD/JPY broke above the March 2017 high of 115.505, a level that had provided resistance on the first attempt in November last year.
Just prior to that, in October, the November 2017 peak of 114.735 provided initial resistance.
In December 2016, USD/JPY made a high at 118.665 which may also provide initial resistance should it be tested again.
This is now a potential pivot point resistance level at 115.505. The recent high of 116.353 might also provide resistance.
On that move higher last week, it also went above the upper 21-day simple moving average (SMA) based Bollinger Band.
It closed 2 sessions outside the bands before a close inside them. It has since moved lower and is below the 10-day SMA. This could suggest that short term bearish momentum is unfolding.
However, the 21, 55 and 100-day SMAs are still below the price and these SMAs may provide support on the way down. If they are broken, then more bearish momentum may evolve.
Support could also be at the previous lows and pivot points of 114.276, 113.960, 113.223, 113.142, 112.533, 112.079, 110.802, 109.113 and 108.723.

CHF/JPY – Technical Analysis
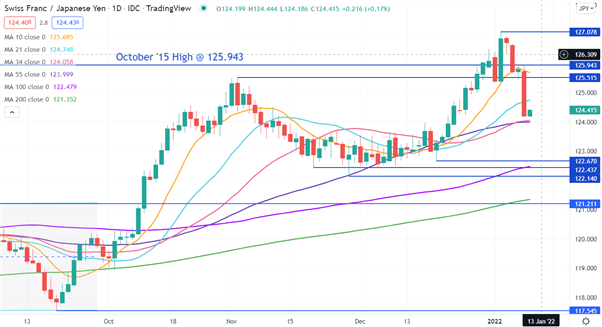
CHF/JPY made a 5 year high last week when it took out the October 2015 peak of 125.945, as well as the November high of last year of 125.515. It has since collapsed back down through these levels, and they might now provide pivot point resistance.
The new high of 127.078 could also offer resistance.
The move back down has gone below the 10 and 21-day SMAs which may suggest that short term bearish momentum might be developing.
The 34 and 55-day SMAs are currently near 124.00 and this level may provide support.
Further down, previous lows and pivot points of 122.670, 122.437, 122.140, 121.211, 118.938 and 117.545 are potential support levels.
Introduction to Technical Analysis
Moving Averages
Recommended by Daniel McCarthy
--- Written by Daniel McCarthy, Strategist for DailyFX.com
To contact Daniel, use the comments section below or @DanMcCathyFX on Twitter


