


Brexit Latest: What's Next for the British Pound?
- Traders should be anticipating a high degree of volatility across the GBP-crosses as the UK parliament tries to determine what the next steps are in the Brexit process.
- The latest Brexit developments leave open a wide possibility of outcomes over the next several weeks; the next 24-hours are critical.
- Retail trader positioning suggests that the current GBPUSD price trend may soon reverse higher despite the fact traders remain net-long.
Looking for longer-term forecasts on the British Pound? Check out the DailyFX Trading Guides.
The Brexit saga is cresting. With UK Prime Minister Boris Johnson’s prorogation of parliament enraging MPs, the political body will meet on Tuesday to try and take back control of the Brexit process. A vote on the afternoon of Tuesday, September 3 will determine whether the UK parliament will control its own schedule; if the vote fails, the prorogation will begin as early as September 9, effectively sidelining parliament for the rest of the Brexit process.
But if the vote passes, then it’s entirely likely a series of steps leads to a no confidence vote in UK PM Johnson, and perhaps ultimately a snap general election. Traders should be anticipating a high degree of volatility across the GBP-crosses.
GBPUSD TECHNICAL ANALYSIS: WEEKLY RATE CHART (JUNE 2016 TO September 2019) (CHART 1)
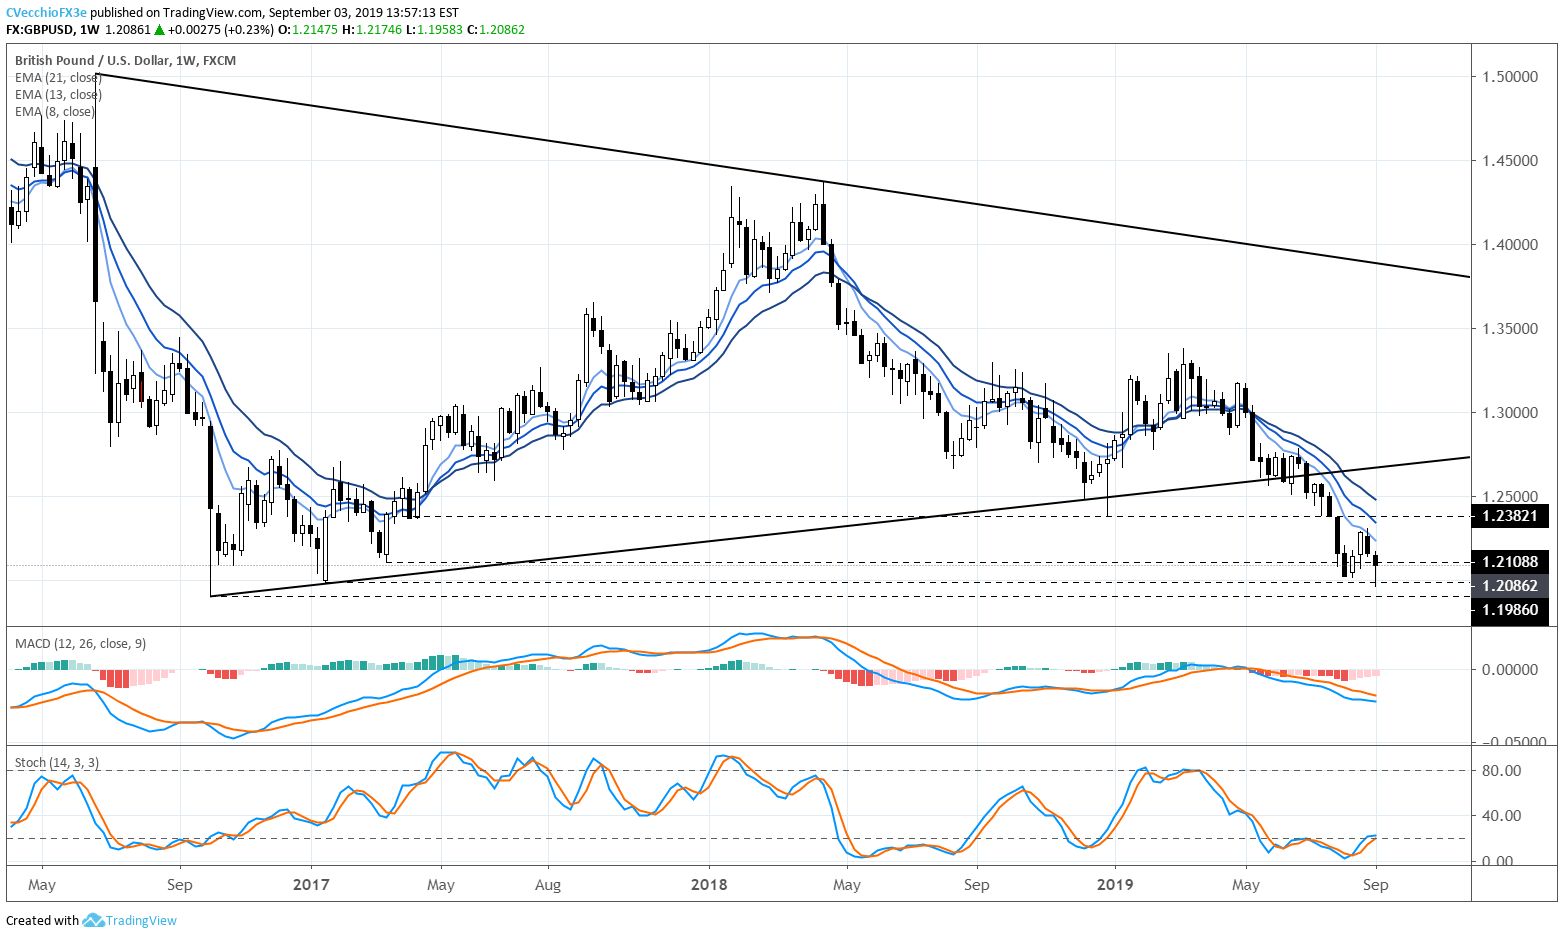
In our last GBPUSD technical forecast update, it was noted that “the January 2017 low is in focus at 1.1986, with the post-Brexit vote in October 2016 coming into focus shortly thereafter at 1.1905.” Indeed, after the long weekend, GBPUSD set a fresh yearly low, breaking through 1.1986.
GBPJPY has yet to retake the weekly 8-EMA, despite the hammer candle forming on the weekly timeframe; GBPUSD prices have remained below the weekly 8- and 13-EMAs since the first week of May. Similarly, both weekly MACD and Slow Stochastics are pointing lower in bearish territory.
It still holds that only a break above the weekly 8-EMA, as well as the descending trendline from the May and June 2019 highs, would give traders reason to expect GBPUSD prices to trend higher.
GBPUSD Technical Analysis: Daily Rate Chart (September 2018 to September 2019) (Chart 2)
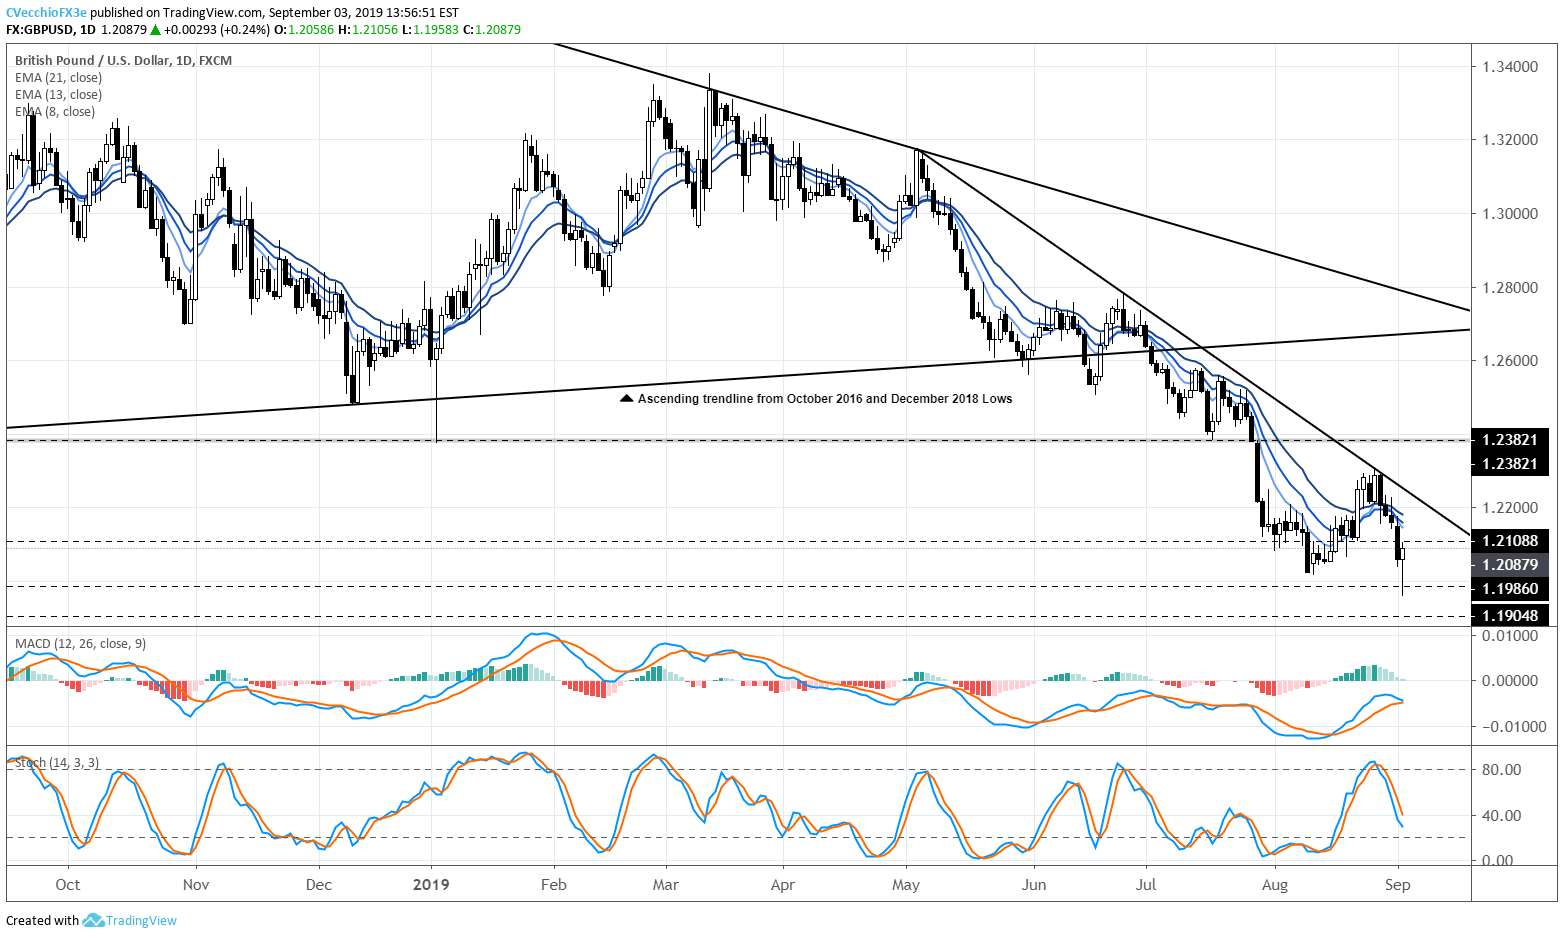
Now that GBPUSD prices have washed out to fresh yearly lows, the next move is highly contingent upon what happens next in the Brexit sage. Already the daily and the weekly candles are forming hammers, suggesting bullish reversal potential. Before then, however, GBPUSD prices must climb above the daily 8-, 13-, and 21-EMA envelope.
IG Client Sentiment Index: GBPUSD Rate Forecast (September 3, 2019) (Chart 3)
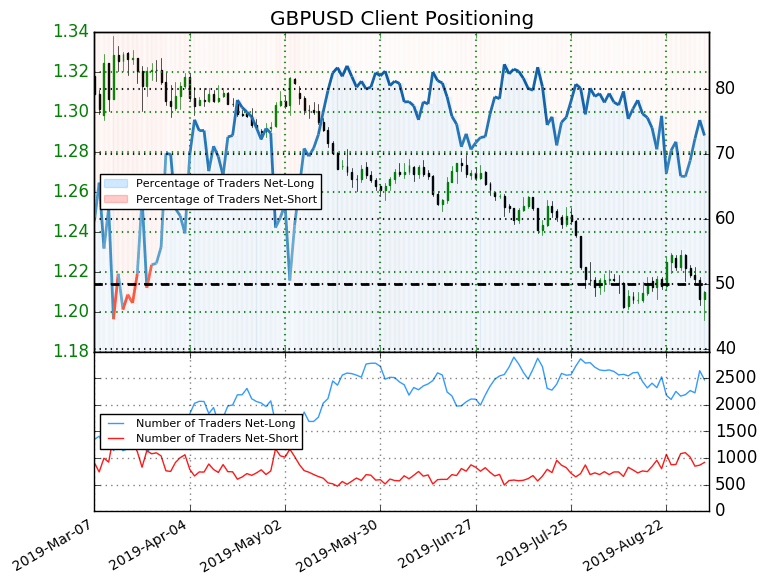
GBPUSD: Retail trader data shows 72.9% of traders are net-long with the ratio of traders long to short at 2.69 to 1. In fact, traders have remained net-long since May 06 when GBPUSD traded near 1.30389; price has moved 7.2% lower since then. The number of traders net-long is 3.1% lower than yesterday and 7.8% higher from last week, while the number of traders net-short is 5.4% higher than yesterday and 10.4% lower from last week.
We typically take a contrarian view to crowd sentiment, and the fact traders are net-long suggests GBPUSD prices may continue to fall. Positioning is less net-long than yesterday but more net-long from last week. The combination of current sentiment and recent changes gives us a further mixed GBPUSD trading bias.
GBPJPY Technical Analysis: Daily Rate Chart (October 2016 to September 2019) (Chart 4)
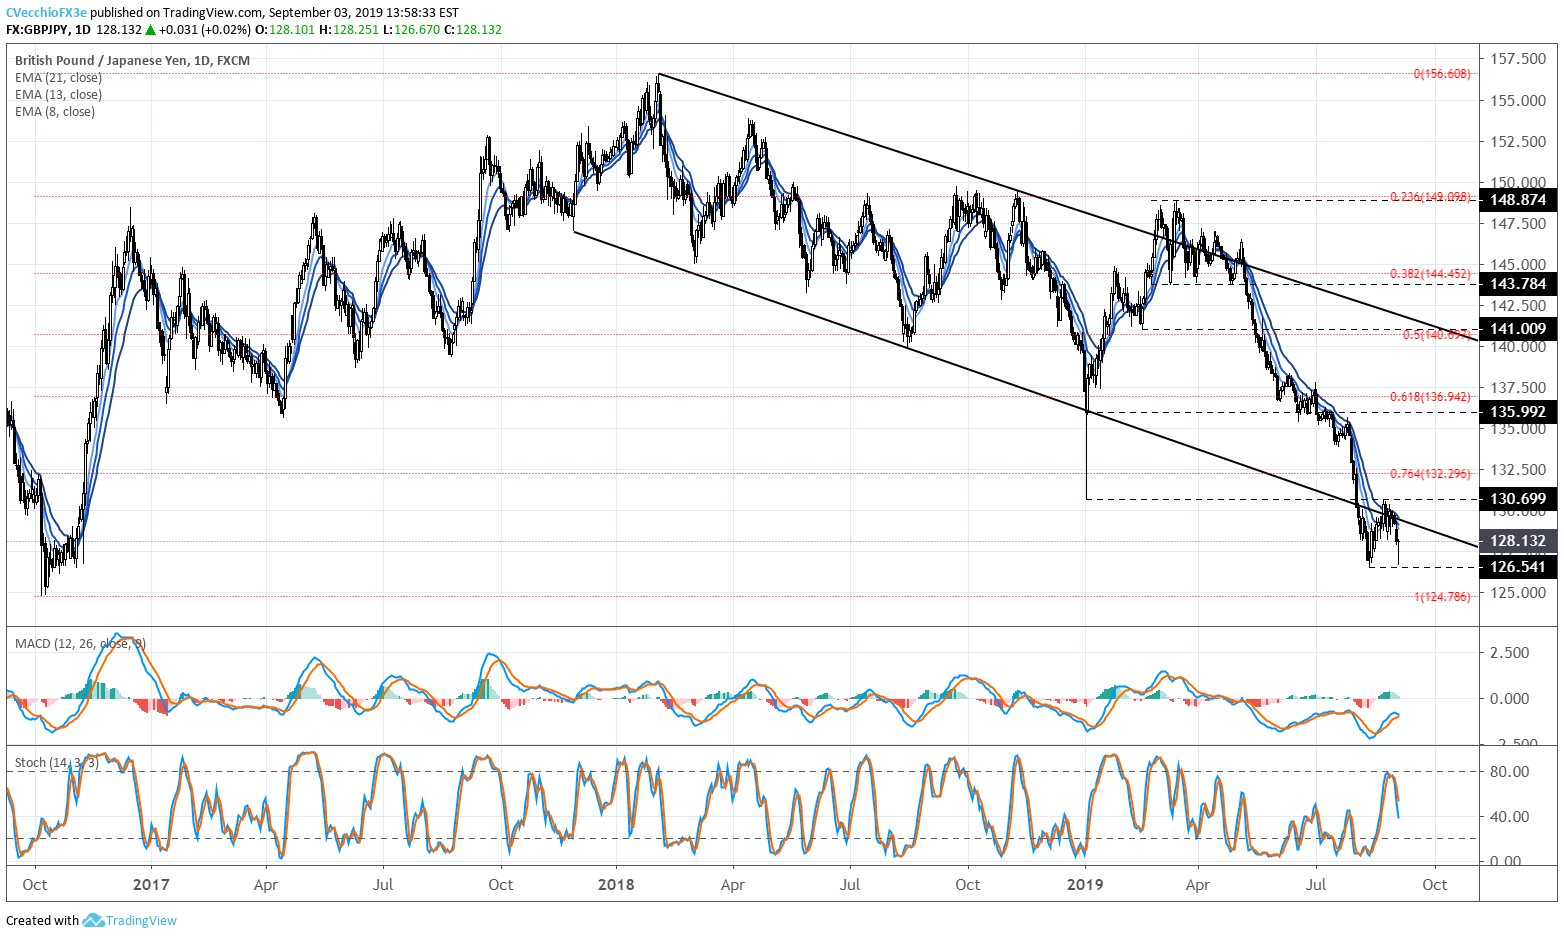
GBPJPY losses continue to consolidate after breaking down through channel support on the way to fresh yearly lows. Now a new short-term range has come into focus when examining GBPJPY price action since the end of July.
GBPJPY Technical Analysis: Daily Rate Chart (August 2018 to September 2019) (Chart 5)
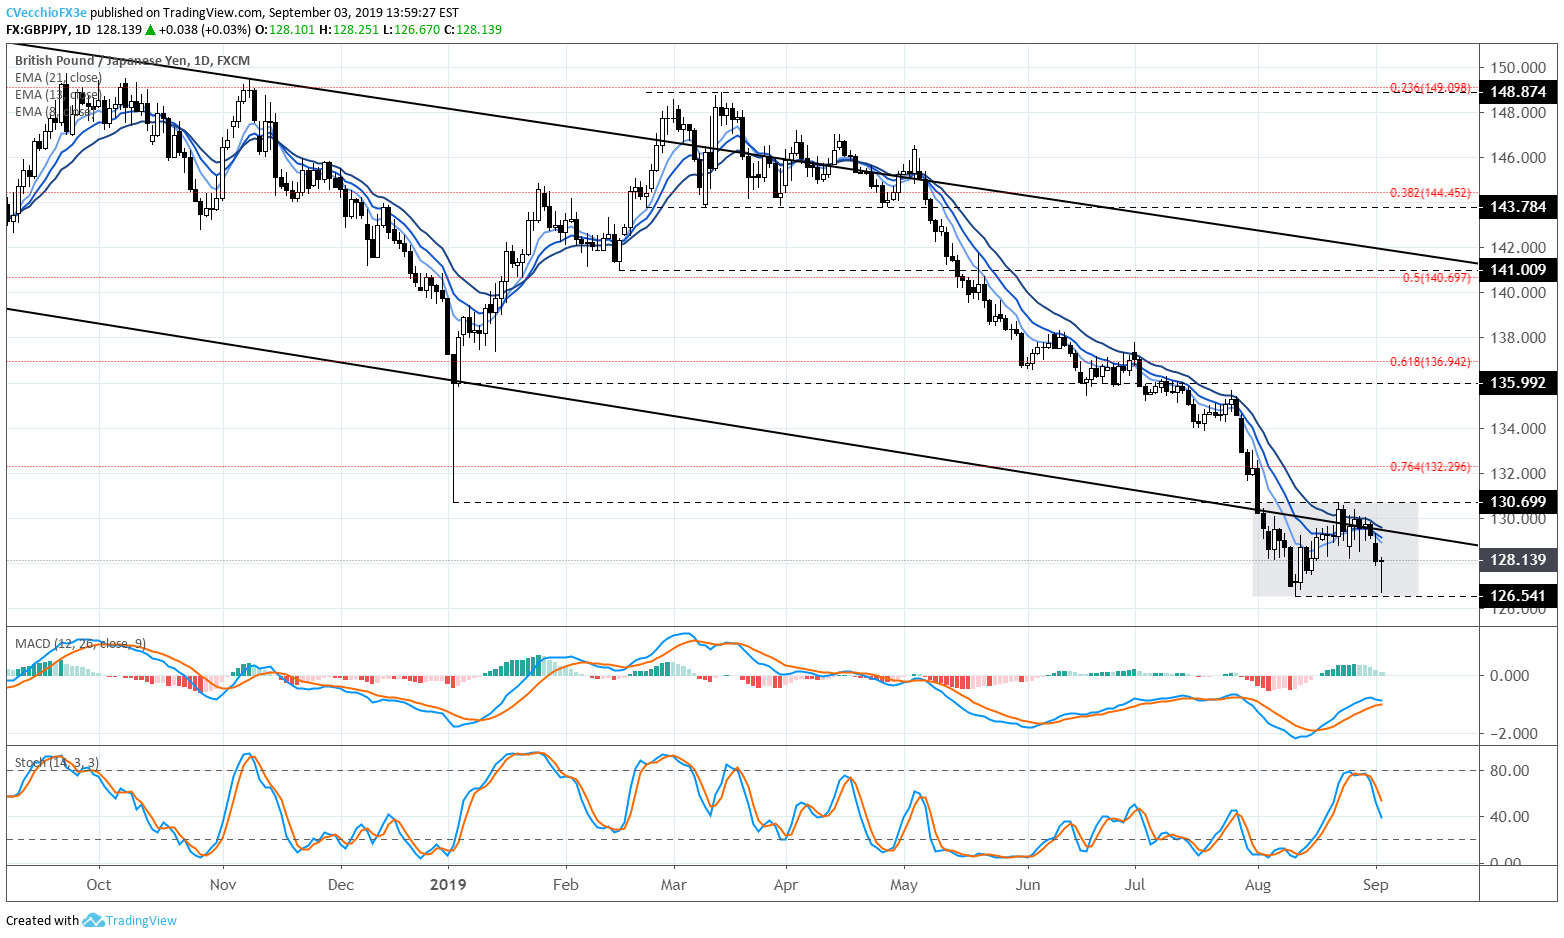
In our last GBPJPY technical forecast update, it was noted that “a break above the former 2019 low (set around the Yen flash crash in January 2019) would suggest a more bottoming effort is coming into shape. A move above 130.70 would suggest the low has been set.” Unfortunately for traders, a break above 130.70 has not occurred; then again, neither did a break below the August low at 126.54 during the GBPJPY selloff earlier today. Thus marks the new short-term range resistance at 130.70 and support at 126.54: until these levels break, the outlook for GBPJPY is neutral.
IG Client Sentiment Index: GBPJPY Rate Forecast (September 3, 2019) (Chart 6)

GBPJPY: Retail trader data shows 68.9% of traders are net-long with the ratio of traders long to short at 2.22 to 1. In fact, traders have remained net-long since May 6 when GBPJPY traded near 146.06; price has moved 12.3% lower since then. The number of traders net-long is 14.3% lower than yesterday and 7.4% lower from last week, while the number of traders net-short is 7.3% lower than yesterday and 5.1% higher from last week.
We typically take a contrarian view to crowd sentiment, and the fact traders are net-long suggests GBPJPY prices may continue to fall. Yet traders are less net-long than yesterday and compared with last week. Recent changes in sentiment warn that the current GBPJPY price trend may soon reverse higher despite the fact traders remain net-long.
EURGBP Technical Analysis: Monthly Rate Chart (1998 to 2019) (Chart 7)
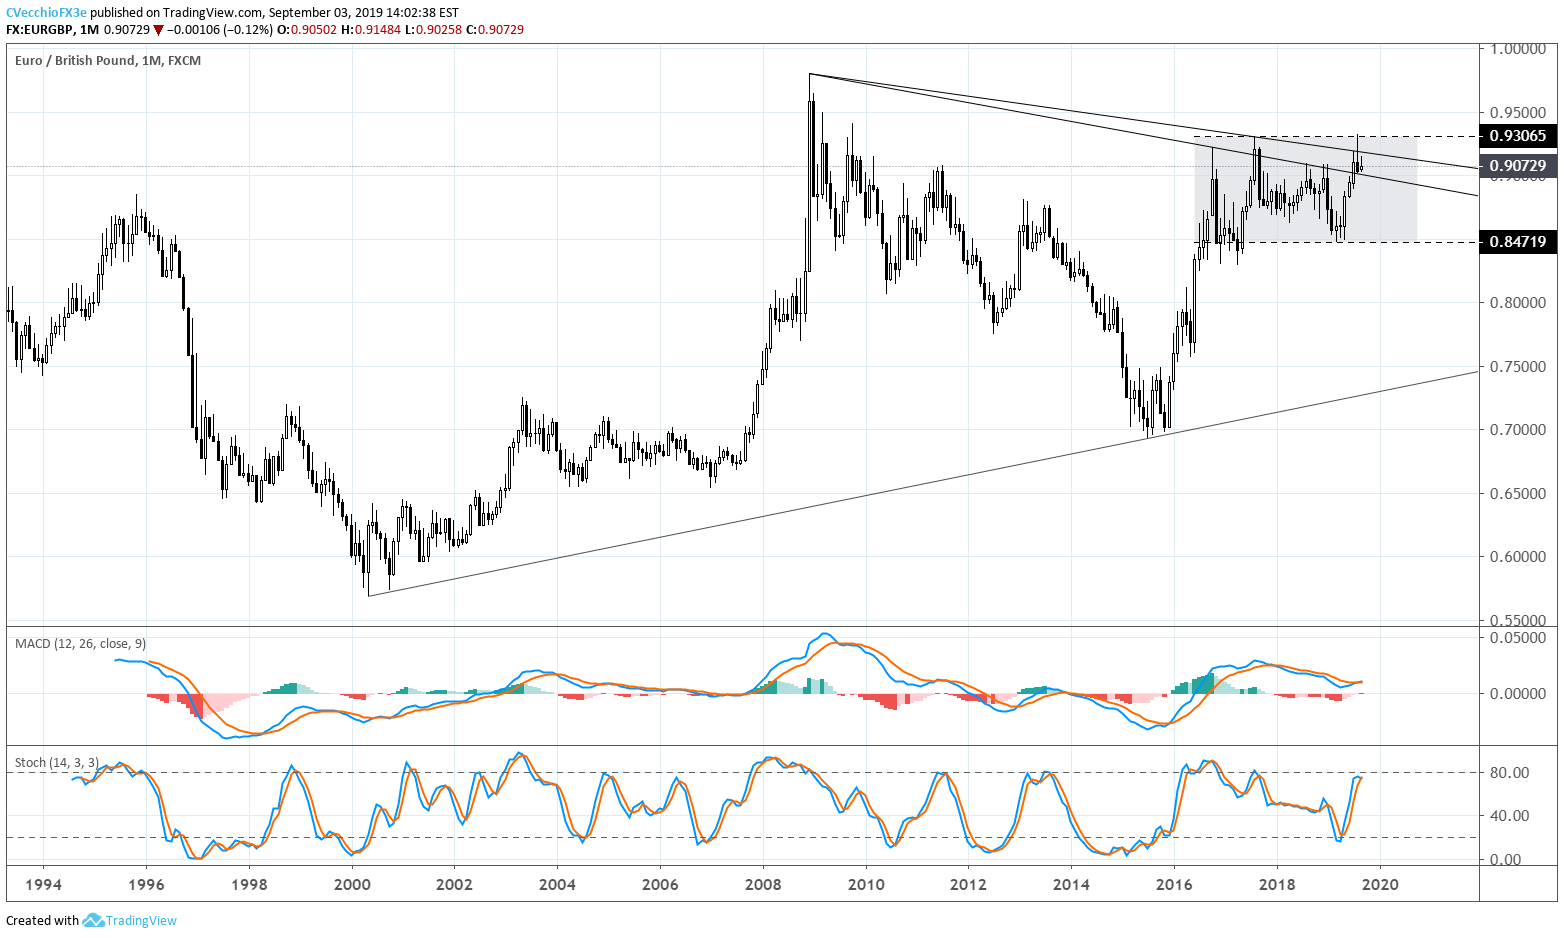
The EURGBP monthly timeframe remains instructive given the August inverted hammer – often a sign of a bearish reversal. As EURGBP challenged the 2017 yearly high last month, there was a failed breakout attempt of the sideways channel going back to early-2017 between 0.8472 and 0.9307.
Failure to find follow through to the topside means that the more significant bullish breakout is on pause: the symmetrical triangle that has defined nearly the entirety of EURGBP’s trading history, going back to the lows in 2000 and the highs in 2008.
EURGBP Technical Analysis: Daily Rate Chart (September 2018 to September 2019) (Chart 8)
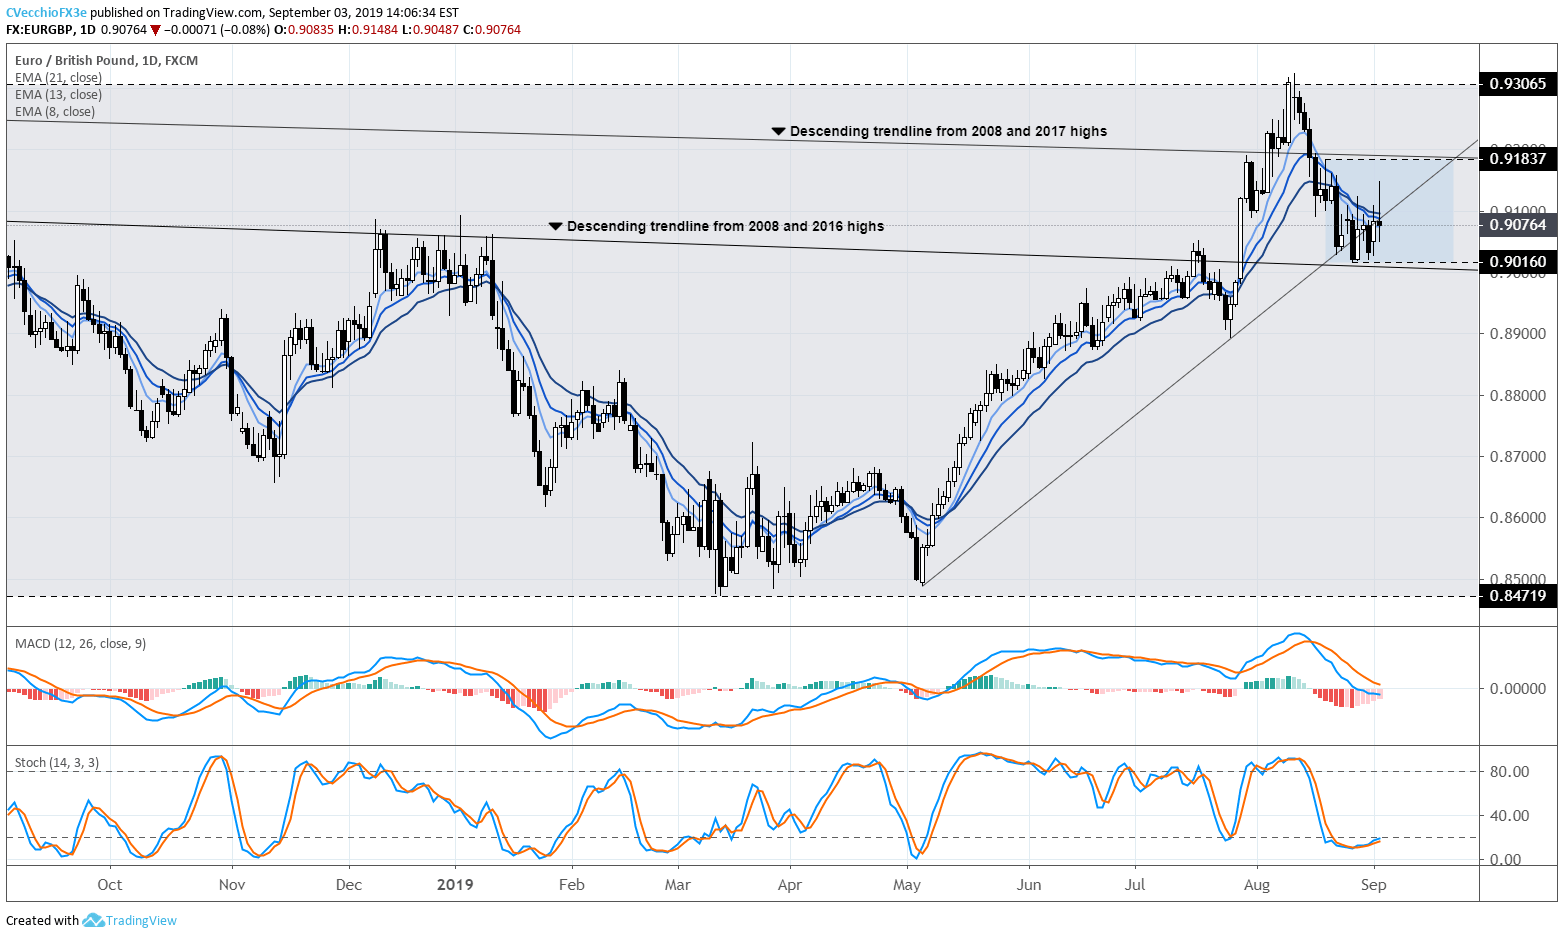
In our last EURGBP technical forecast update, it was noted that “both daily MACD and Slow Stochastics continue to trend lower. EURGBP prices have moved sideways, and given that trading is both a function of price and time, EURGBP now finds itself below the rising trendline from the May and July 2019 swing lows. A drop below the descending trendline from the 2008 and 2016 highs would suggest a deeper pullback.”
Not much has changed. Bearish momentum has increased in recent days, with EURGBP prices holding below the daily 8-, 13-, and 21-EMA envelope thanks to the inverted hammer forming on the daily and weekly timeframe; daily MACD has turned lower in bearish territory; and Slow Stochastics has initiated a crossover near oversold territory.
For now, traders should keep an eye on the range defined by the August 20 bearish outside engulfing bar and the August low between 0.9016 and 0.9184. Within these rates, the EURGBP outlook is neutral. The scope for a deeper pullback would exist below 0.9016, give the break of the uptrend from the May and July 2019 lows as well as the drop back under the descending trendline from the 2008 and 2016 highs.
IG Client Sentiment Index: EURGBP Rate Forecast (September 3, 2019) (Chart 9)

EURGBP: Retail trader data shows 32.7% of traders are net-long with the ratio of traders short to long at 2.05 to 1. In fact, traders have remained net-short since May 9 when EURGBP traded near 0.8651; price has moved 4.8% higher since then. The number of traders net-long is 1.4% higher than yesterday and 4.5% higher from last week, while the number of traders net-short is 12.0% lower than yesterday and 22.2% lower from last week.
We typically take a contrarian view to crowd sentiment, and the fact traders are net-short suggests EURGBP prices may continue to rise. Yet traders are less net-short than yesterday and compared with last week. Recent changes in sentiment warn that the current EURGBP price trend may soon reverse lower despite the fact traders remain net-short.
What Happens to the British Pound: No Deal, Hard Brexit
Under a no-deal, hard Brexit outcome, traders should expect further losses by the British Pound, with EURGBP likely to trade closer to parity (1.0000), GBPJPY could trade towards 120.00, while GBPUSD could fall towards 1.1000 during the first 12-months of a no-deal, hard Brexit (keeping in mind that the European Central Bank and Federal Reserve would likely cut interest rates to prevent Brexit shocks from impacting either the Eurozone or US economies too significantly, thereby capping potential gains by the Euro and the US Dollar versus the British Pound).
What Happens to the British Pound: No Deal, Hard Brexit + Scottish Exit
But this would not be the worst case scenario for the British Pound; in the event that Scotland holds a second independence referendum, it’s likely markets will be facing down the threat of disintegration of Great Britain as we know it. Under a no-deal, hard Brexit coupled with a Scottish vote to leave the UK, traders should expect EURGBP to climb towards 1.0500, GBPJPY to fall towards 112.50, and GBPUSD to drop closer to 1.0500.
What Happens to the British Pound: General Election
There is scope for a short-term recovery for the British Pound if it appears that a no-deal, hard Brexit is delayed. This could come in the form of a general election that replaces Brexit hardliner Boris Johnson as UK prime minister. The vote on Tuesday, September 3 should be watched closely to see if the UK parliament is able to retake control of its schedule and avoid prorogation. In the event of a delay in the Brexit process, EURGBP could fall back towards 0.8600, GBPJPY could trade towards 133.00, while GBPUSD could rise towards 1.2600
What Happens to the British Pound: Second Referendum
The only hope that the British Pound has for a significant recover is if Brexit is avoided altogether: after all, it will be impossible to replace the economic activity lost endured from leaving the EU, the world’s largest single market. In the event that the next UK prime minister has a change of heart and takes steps to avoid Brexit (e.g. a second referendum or withdrawing Article 50), EURGBP could fall back towards 0.8300, GBPJPY could rally back towards 145.00, and GBPUSD could climb back towards 1.4000; a full-scale recovery back to pre-June 2016 Brexit vote levels is highly unlikely in the immediate aftermath of the cancellation of Brexit.
FX TRADING RESOURCES
Whether you are a new or experienced trader, DailyFX has multiple resources available to help you: an indicator for monitoring trader sentiment; quarterly trading forecasts; analytical and educational webinars held daily; trading guides to help you improve trading performance, and even one for those who are new to FX trading.
--- Written by Christopher Vecchio, CFA, Senior Currency Strategist
To contact Christopher Vecchio, e-mail at cvecchio@dailyfx.com
Follow him on Twitter at @CVecchioFX
View our long-term forecasts with the DailyFX Trading Guides


