


Dow Jones Talking Points:
- The 2019 US equity rally has continued into this week, as the Dow Jones Industrial Average set a fresh three-month-high on Monday. Since then, prices have been pulling back but support has continued to hold with the index currently re-testing the 26k psychological level.
- At this point, short-term strategies will likely be focusing on bullish continuation themes, looking for 2019 strength to continue. On a longer-term or swing-basis, the potential for reversal is building as noted by a rising wedge formation building near November/December swing-highs.
- DailyFX Forecasts on a variety of currencies such as the US Dollar or the Euro are available from the DailyFX Trading Guides page. If you’re looking to improve your trading approach, check out Traits of Successful Traders. And if you’re looking for an introductory primer to the Forex market, check out our New to FX Guide.
Do you want to see how retail traders are currently trading the US Dollar? Check out our IG Client Sentiment Indicator.
The 2019 US equity rally has continued into this week as the Dow Jones Industrial Average set a fresh three-month-high on Monday. The index is now re-testing the 26,000 psychological level as prices have pulled back in the face of a heavy economic calendar. The past two days have seen FOMC Chair Jerome Powell testify on Capitol Hill as part of the Fed’s twice-annual testimony in-front of Congress; and while Chair Powell avoided any direct signals of future rate hikes or tighter policy options at the Fed, US stocks remain on their heels after a very strong eight-week run.
Dow Jones Four-Hour Price Chart: Test of 2019 Support Trend-Line
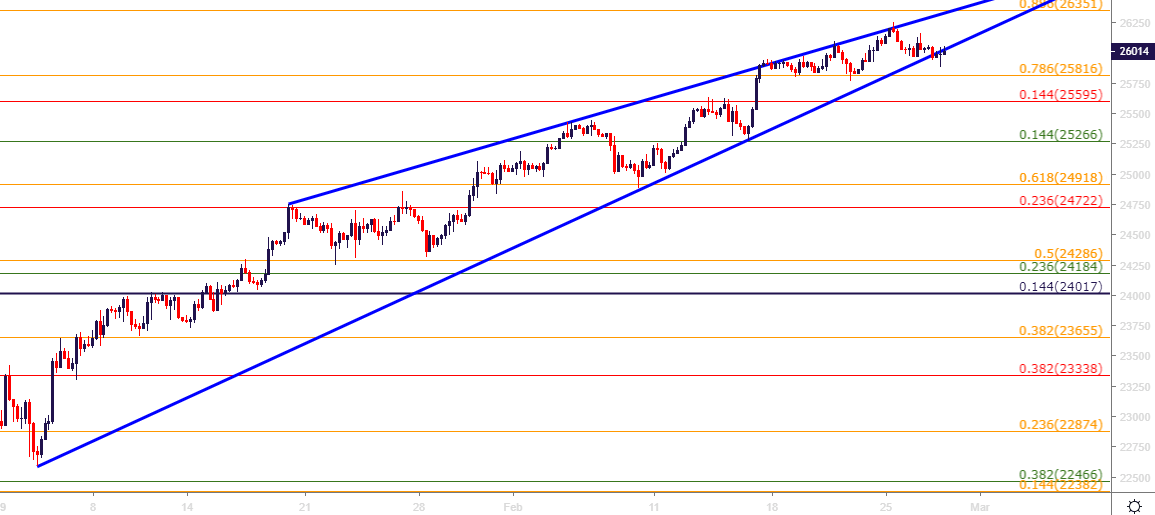
Chart prepared by James Stanley
Dow Jones Short-Term
The big question on a short-term basis in the index is for how long the bullish theme might run. Prices have stayed on a consistent trajectory throughout 2019 with buyers continually offering higher-low support, and that’s been in stark contrast to the bearish themes of Q4. As shown above, price action is in the process of testing the bullish trend-line that’s held the lows for the bulk of this year.
For those looking at bullish continuation approaches, support potential exists at the Fibonacci level at 25,816, as this is the 78.6% retracement of that Q4 sell-off. A bit lower brings the 14.4% marker of the post-Election run in the Dow, taking the low from November 2016 up to last year’s high. That level rests at 25,595 and this is the same price that had held the highs in the Dow in mid-February. And below that is another possible level of interest around 25,266, as this is the 14.4% retracement of the 2015-2018 major move, and this is the price that had helped to set the low in the index in the middle of this month. A break-below that support brings to question the viability of continuation themes of the bullish trend.
Dow Jones Two-Hour Price Chart
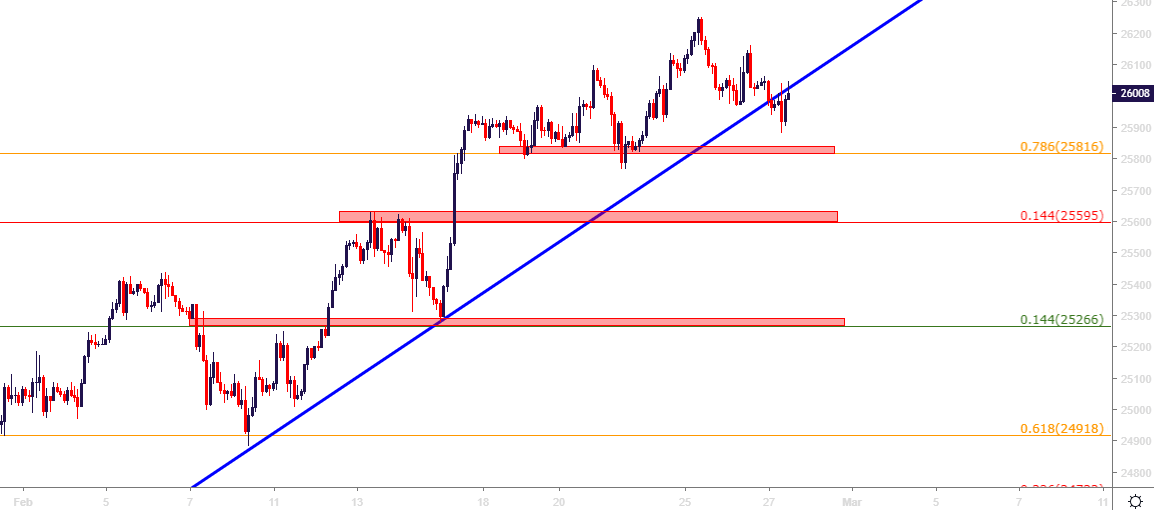
Chart prepared by James Stanley
Dow Jones: Reversal Potential
As shown in the first chart in this article, the Dow is currently building into a rising wedge pattern. This type of formation will often be approached with the aim of bearish reversals; largely looking for the lack of enthusiasm from buyers at highs to eventually take-over, opening the door for bears to take-control. But, given the motivation that’s been pushing stocks-higher so far this year, that can be a difficult case to make. So, for those looking at bigger-picture reversals in US stocks, following a continued downside break from this formation, could begin to open the door for such a scenario. A downside break through the two-week-low around 25,764 could be an early signal of impending reversal potential.
Dow Jones Eight-Hour Price Chart
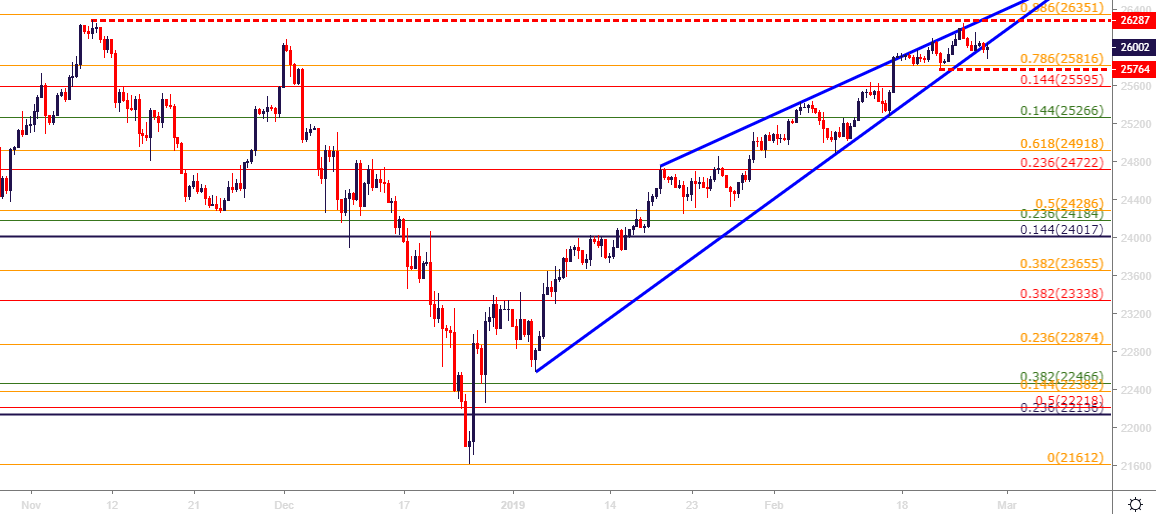
Chart prepared by James Stanley
You may also be interested in:
Day Trading the Dow Jones: Strategies, Tips & Trading Signals
To read more:
Are you looking for longer-term analysis on the U.S. Dollar? Our DailyFX Forecasts for Q4 have a section for each major currency, and we also offer a plethora of resources on USD-pairs such as EUR/USD, GBP/USD, USD/JPY, AUD/USD. Traders can also stay up with near-term positioning via our IG Client Sentiment Indicator.
Forex Trading Resources
DailyFX offers a plethora of tools, indicators and resources to help traders. For those looking for trading ideas, our IG Client Sentiment shows the positioning of retail traders with actual live trades and positions. Our trading guides bring our DailyFX Quarterly Forecasts and our Top Trading Opportunities; and our real-time news feed has intra-day interactions from the DailyFX team. And if you’re looking for real-time analysis, our DailyFX Webinars offer numerous sessions each week in which you can see how and why we’re looking at what we’re looking at.
If you’re looking for educational information, our New to FX guide is there to help new(er) traders while our Traits of Successful Traders research is built to help sharpen the skill set by focusing on risk and trade management.
--- Written by James Stanley, Strategist for DailyFX.com
Contact and follow James on Twitter: @JStanleyFX


