


Indices Technical Forecast: Neutral
- S&P 500 coming off record highs, looking to trend support
- Dow Jones holding up the best of the three big indices
- Nasdaq 100 looking to test bull market channel

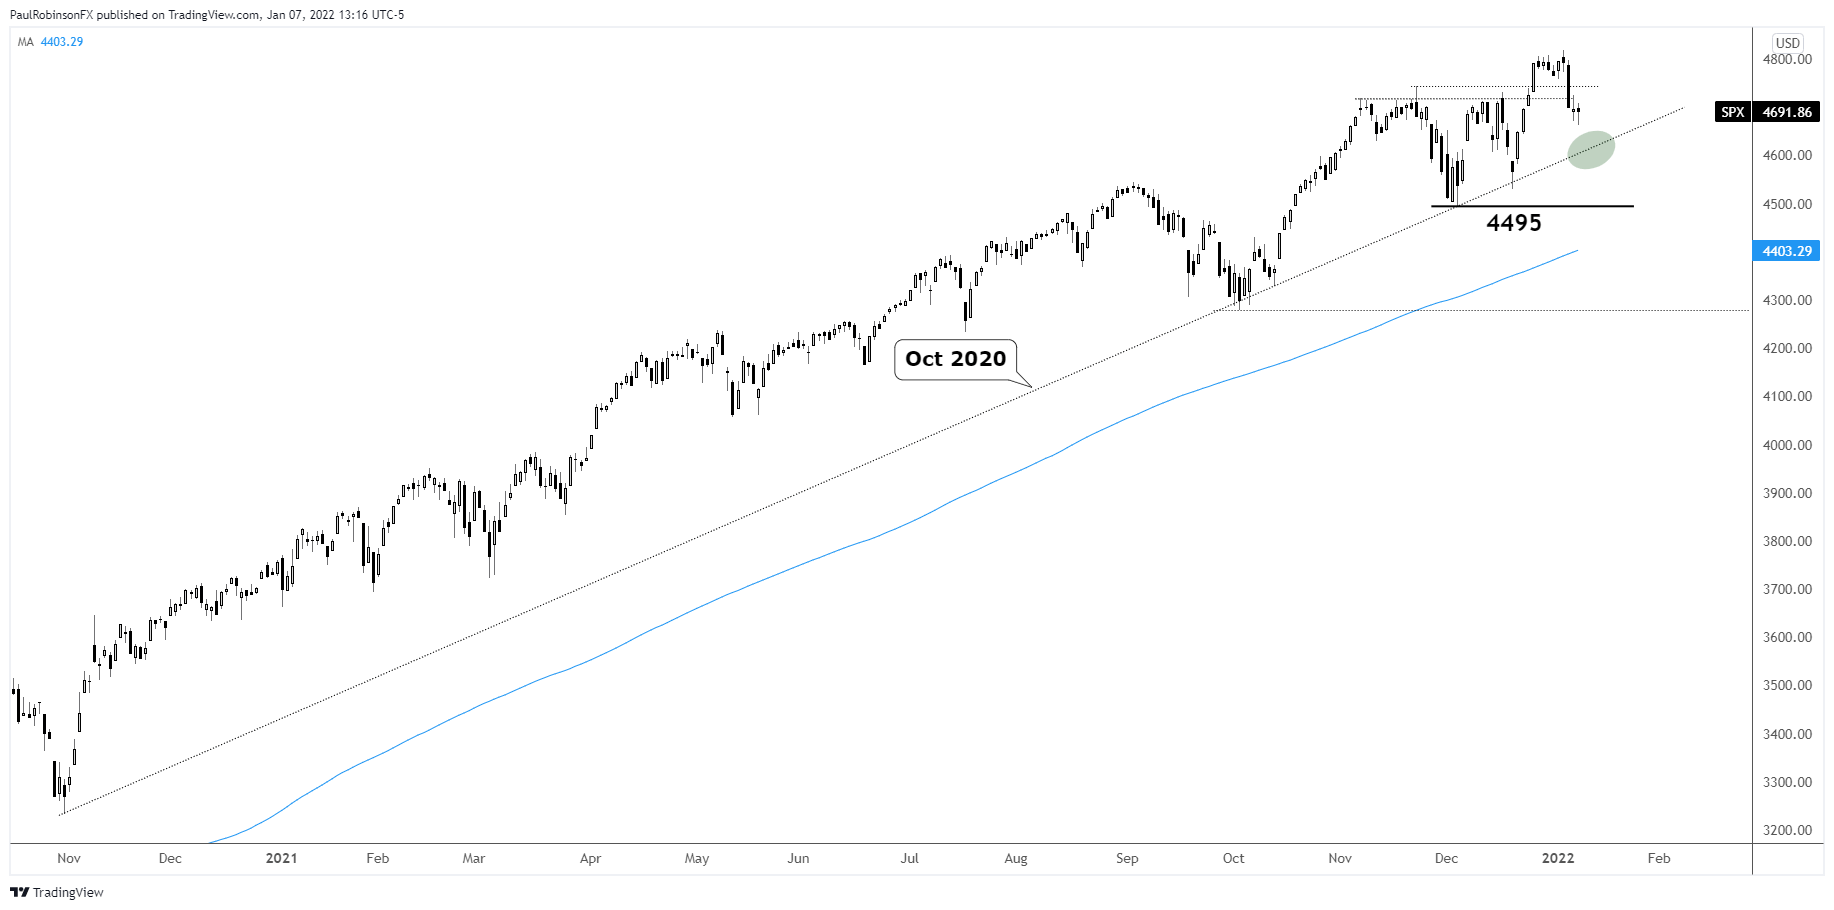
S&P 500 Technical Forecast
The S&P 500 is weakening from the record highs, and on that trend support from October 2020 is coming into focus. It held well last month, we will see if it can again. For now, giving trend and support the benefit of the doubt.
From a tactical standpoint, a reversal off support could pave the way for longs to work back towards a new record high. If, however, we see support fail to usher in buying, then a breakdown could have the market on its heels in a larger corrective pattern, possibly worse.
S&P 500 Daily Chart
Dow Jones Technical Forecast
The Dow Jones is faring better than the S&P and Nasdaq, so this bodes well for the top-side as long as this can remain the case. Keep an eye on how the broader SPX handles support, assuming it tags it in the days ahead. Continued relative strength could make the Dow a more attractive long if renewed stock market strength is to become a theme again soon.
Dow Jones Daily Chart

Dow Jones Chart by Tradingview
Nasdaq 100 Technical Forecast
The Nasdaq 100 is lagging behind quite a bit and is of concern for the broader market given its general leadership status. But it could be rotation out of higher beta new school names into old school names that reverses course. The NDX is testing horizontal support here around the 15550/650 area. More importantly, though, we need to watch the lower channel line from September 2020. Holding onto the upward channel structure will be important if we are to see this recent bout of weakness turn out to be nothing more than a correction. A breakdown out of the channel could pave the way for a larger trend reversal.
Nasdaq 100 Daily Chart

Nasdaq 100 Chart by Tradingview
Resources for Forex Traders
Whether you are a new or experienced trader, we have several resources available to help you; indicator for tracking trader sentiment, quarterly trading forecasts, analytical and educational webinars held daily, trading guides to help you improve trading performance, and one specifically for those who are new to forex.
---Written by Paul Robinson, Market Analyst
You can follow Paul on Twitter at @PaulRobinsonFX


