


Copper Price Outlook:
- The recent symmetrical triangle consolidation yielded a bullish resolution as anticipated in the prior copper price forecast update. Now, copper prices may be set for a return to their yearly high – and then some.
- A drop in global bond yields alongside roundly positive economic news has increased the growth appeal of copper prices, while news flow otherwise has been encouraging.
- The long-term view (both 1Q'21 and 2Q'21 top opportunities) remains on track, insofar as the multi-year trendline break suggests that a bullish view is appropriate for copper prices.
Copper Prices Nearing Yearly High
Just three weeks ago, copper prices were in the midst of an extended losing streak, spurred on by a jump in global bond yields. With investors shifting asset allocations amidst higher sovereign rates, growth-sensitive assets – base metals, energy, tech stocks – took a back seat. At the time, it was written that “it may be the case that the recent consolidation in copper prices is a much-needed breather after a multi-week surge…[but] it stands to reason that the fundamental backdrop for copper prices remains strong.”
Throughout April, a seasonally bullish period for risk assets, the path has been paved for investors to embrace growth-sensitive assets once more. Thanks to the persistent drumbeat by central bankers that higher bond yields aren’t an issue anyway, seeing as how they reflect economic optimism, stability in global bond yields has prevailed.
News flow around copper has been otherwise positive as well, with Goldman Sachs upgrading its 2025 price target to $15,000 per metric ton. The investment bank’s report called copper “the new oil,” and that “the market is facing a current supply crunch which could boost the commodity’s price by more than +60% in four years.”
Now, considering that the symmetrical triangle noted in the prior copper price forecast yielded a bullish resolution in the interim period, the market may be pacing for a return to its yearly highs in the coming weeks.

COPPER PRICE TECHNICAL ANALYSIS: DAILY CHART (March 2020 to April 2021) (CHART 1)
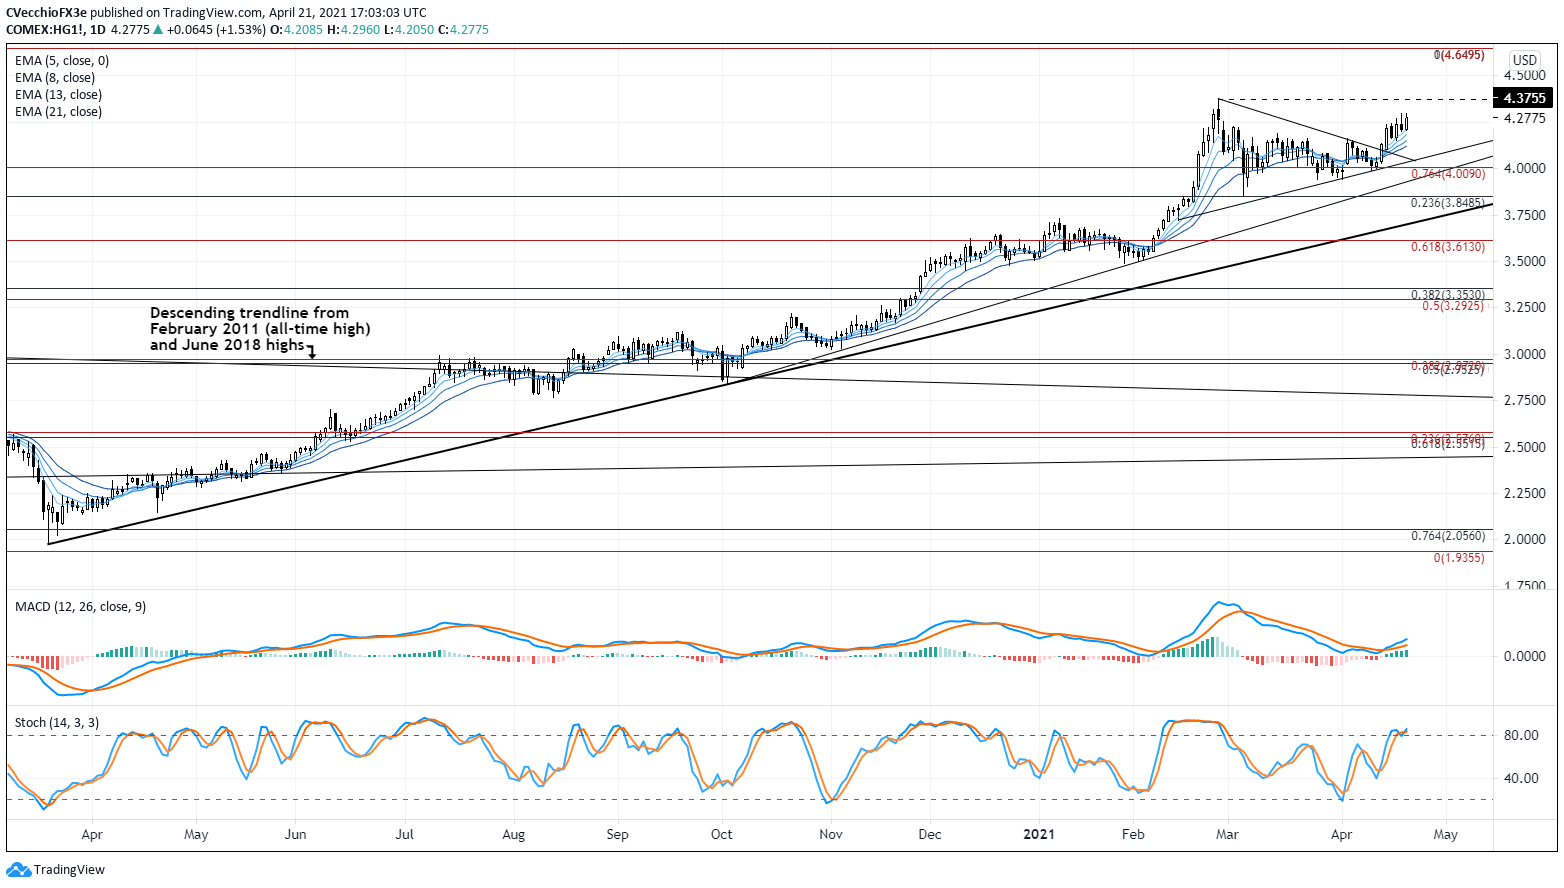
In the prior copper price forecast, it was noted that “given the fact that the symmetrical triangle formed with the preceding move of the bullish variety, continuation higher is eyed. In the last copper price forecast it was also noted that ‘with the fundamental backdrop supportive, the modus operandi for copper traders should be to buy the dip at present time.’” Copper prices have indeed found bullish resolution, with copper prices in the past two days rising to their highest level since February 25 – the day that the yearly high was established.
With a strong fundamental backdrop, the technical picture looks promising as well. Copper prices are above their daily 5-, 8-, 13-, and 21-EMA envelope, which is in bullish sequential order. Daily MACD continues to rise while above its signal line, while daily Slow Stochastics are nestled in bullish territory. The path of least resistance is higher in the near-term, plain and simple; the yearly high at 4.3755 may soon be reached.
COPPER PRICE TECHNICAL ANALYSIS: WEEKLY CHART (November 2008 to April 2021) (CHART 2)
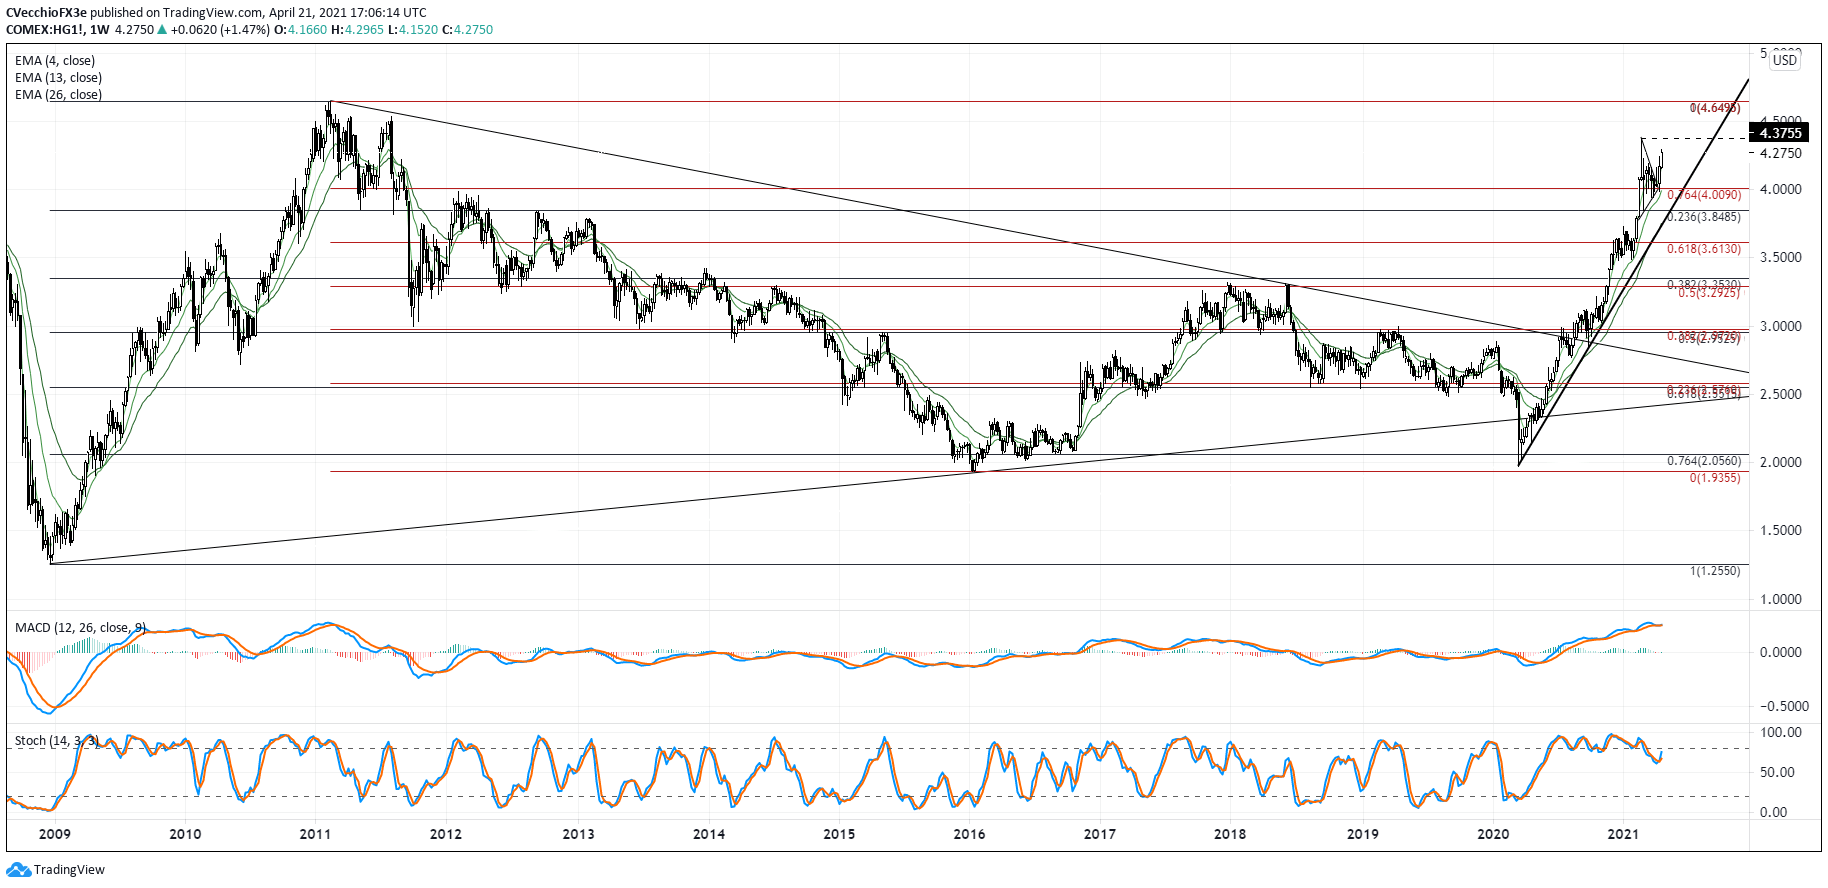
The perspective noted in mid-February remains valid: “Copper prices’ breakout above the descending trendline from the February 2011 and June 2018 highs suggests that a multi-year bottoming process commenced in mid-2020. This point of view is reinforced by the failed bearish breakout in early-2020, which saw the multi-year symmetrical triangle support temporarily lost for a few weeks. Clearing the June 2018 high officially ended the multi-year series of ‘lower highs and lower lows.’ As long as the uptrend from the March and October 2020 swing lows is maintained, copper prices retain a bullish bias.”

--- Written by Christopher Vecchio, CFA, Senior Currency Strategist


