


Dow Jones, Nasdaq 100, DAX 30 Forecasts: Bullish
- The Dow Jones looks to test topside resistance derived from prior highs as it surges to new records
- The Nasdaq 100 will attempt to recover an important trendline in an effort to stave off further losses
- Like the Dow Jones, the DAX 30 has enjoyed break higher that could open the door to an extension higher
Dow Jones Technical Forecast
Outlook: Bullish
The Dow Jones continues to be the standout performer among the US indices as it extended into record territory last week. Days of essentially unabated gains have seen the Industrial Average take aim at an ascending trendline overhead. Should a breakout occur, the Dow Jones could see its rally kick into high gear as resistance falls by the wayside.
Dow Jones Price Chart: Daily Time Frame (January 2020 – March 2021)
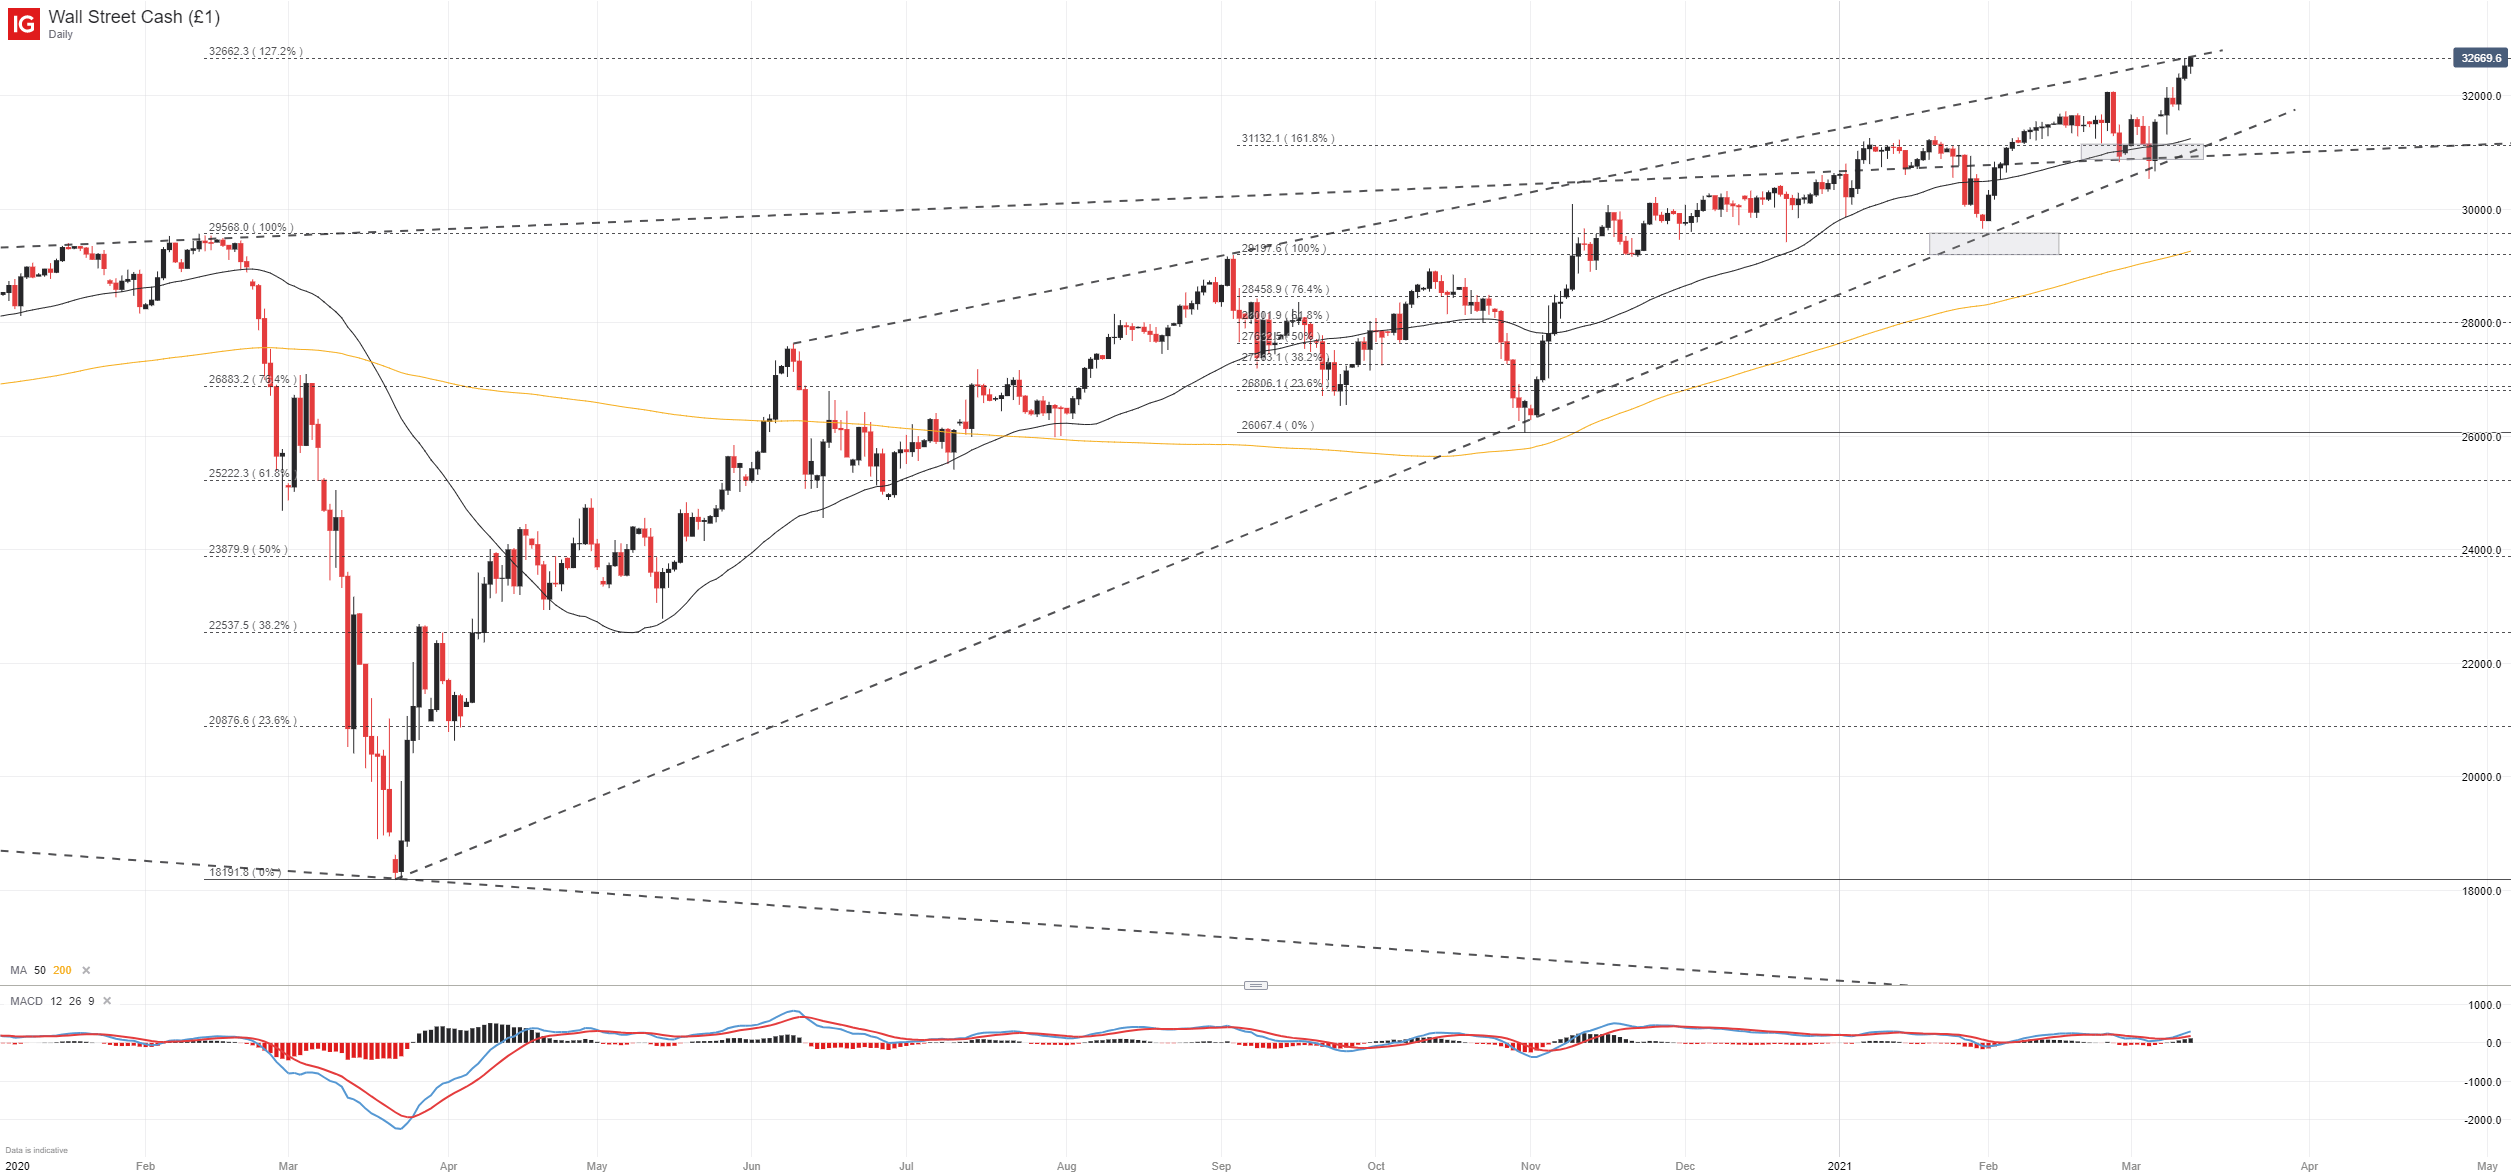
To that end, the Dow Jones will look to pass through the barrier around 32,645 where a Fibonacci extension and rising trendline from June connect. Together, the levels work to create a notable area of resistance that could see gains slow. If resistance leads to risk aversion, the Dow might seek support around the psychological 32,000 mark before retreating further to the collection of technical levels around 31,130.

Nasdaq 100Technical Forecast
Outlook: Neutral
While the Dow Jones look to drive further into uncharted territory, the Nasdaq 100 struggles to recoup recent losses. A midweek recovery saw the Nasdaq break through the recently-formed descending trendline from February, but gains have since stalled as fundamental headwinds flared.
The Trend is Your Friend: Forex Trendlines
Nevertheless, Friday price action saw the MACD line cross above the signal line on the daily chart even as bulls struggled to stave off losses. Crucially, the crossover took place beneath the 0 level while price traded above the 200-day exponential moving average. Thus, the boxes that might suggest gains are ahead in the coming weeks have been checked.
Nasdaq 100 Price Chart: Daily Time Frame (February 2020 – March 2021)
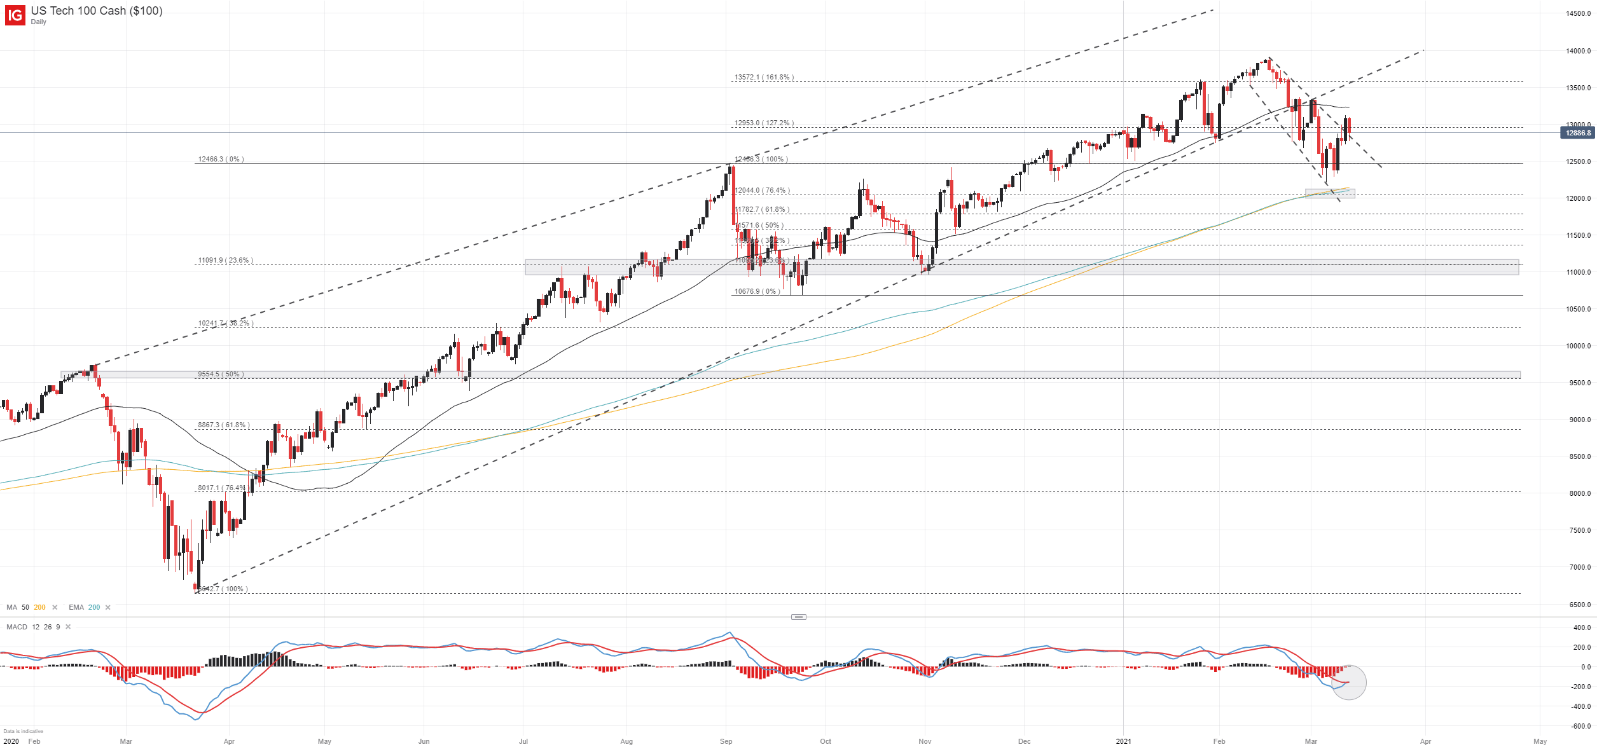
That said, bullish price action is not guaranteed as there is a conflicting MACD signal on the 4-hour price chart. Given the high-profile event risk next week, uncertainty and conflicting signals make Nasdaq 100 price prognostications difficult for the week ahead. If bearishness does materialize, initial support might reside near recent lows at 12,735 followed by 12,250. In the meantime, follow @PeterHanksFX on Twitter for updates and analysis.
DAX 30 Technical Forecast
Outlook: Bullish
The DAX 30 performed its best Dow Jones impression last week as it broke above longstanding resistance around the 14,200 area. The line had helped keep the German equity index contained for the entirety of 2021 thus far, so the bullish break may have opened the door to an extension higher. Since the DAX trades in uncharted territory, resistance is rather sparse aside from a Fibonacci extension around 14,778.
DAX 30 Price Chart: Daily Time Frame (February 2020 – March 2021)

After serving as resistance for months, the ascending trendline from March 2020 may serve as support going forward.

--Written by Peter Hanks, Strategist for DailyFX.com


