


CAD Analysis and Talking Points
See the DailyFX Q2 FX forecast to learn what will drive the currency throughout the quarter.
USDCAD | Range Remains Intact
Range trading has been the case for USDCAD over the past month with the pair failing to discover much in the way of a firm direction. This range has also narrowed in recent sessions to 1.33-1.34, which has continued to contain price action. As trend signals remain weak, there is little to suggest that the 1.3250-1.3465 range will be broken in the near term. With focus on Canadian CPI, option markets imply a 45pip move.
Support 1: 1.3300
Support 2: 1.3280
Support 3: 1.3250
Resistance 1: 1.3400
Resistance 2: 1.3440
Resistance 3: 1.3465
USDCAD PRICE CHART: Daily Time Frame (Jan 2019 – Apr 2019)

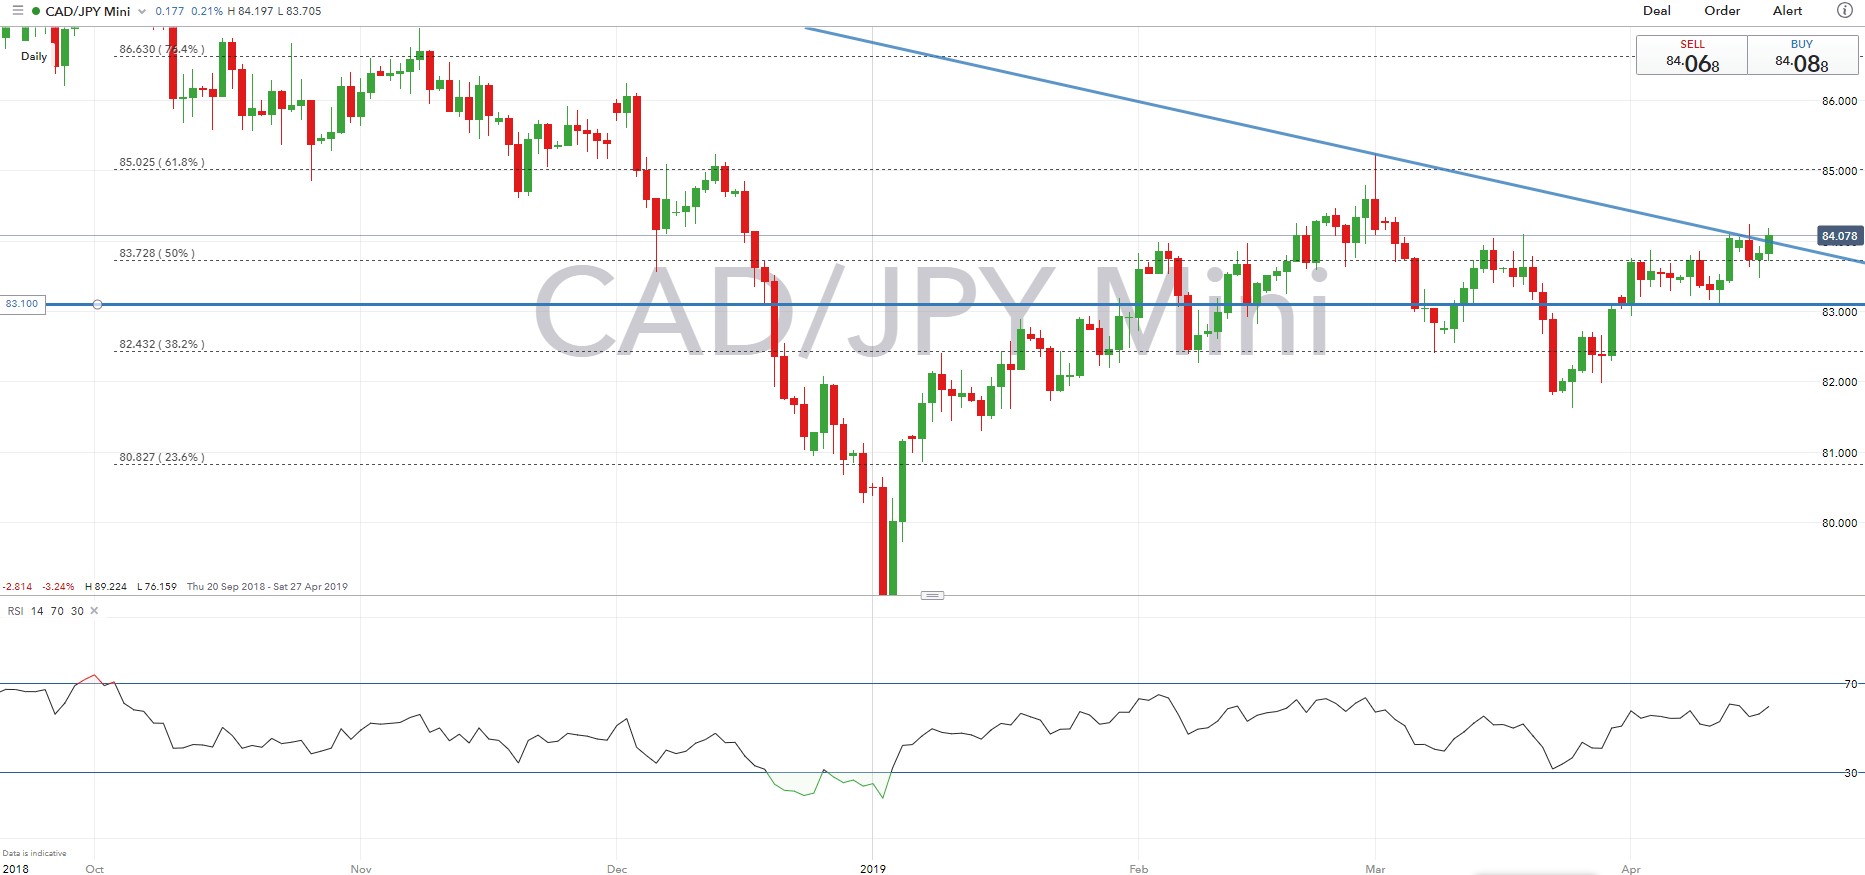
CADJPY | Trendline Resistance Pivotal
While momentum indicators have been modestly bullish, trendline resistance has capped further upside and thus remains pivotal as to the direction that CADJPY goes next. Given the improvement in risk appetite and boost in oil prices, short term gains for the cross look to be on the cards with the 200DMA in sight at 84.50. However, a rejection from trendline resistance could see the cross make a move towards support at 83.40, while further support is situated at 83.10.
CADJPY PRICE CHART: Daily Time Frame (Sep 2018–Apr 2019)
--- Written by Justin McQueen, Market Analyst
To contact Justin, email him at Justin.mcqueen@ig.com
Follow Justin on Twitter @JMcQueenFX


