


AUD Analysis and Talking Points
- AUDUSD | Trendline Resistance in Focus
- AUDJPY | Pullback From 84.00, However, Momentum Suggests Upside
- AUDNZD | Critical Trendline Support from Record Low Curbs Downside
See our Q4 FX forecast to learn what will drive the currency throughout the rest of the year.
AUDUSD | Trendline Resistance in Focus
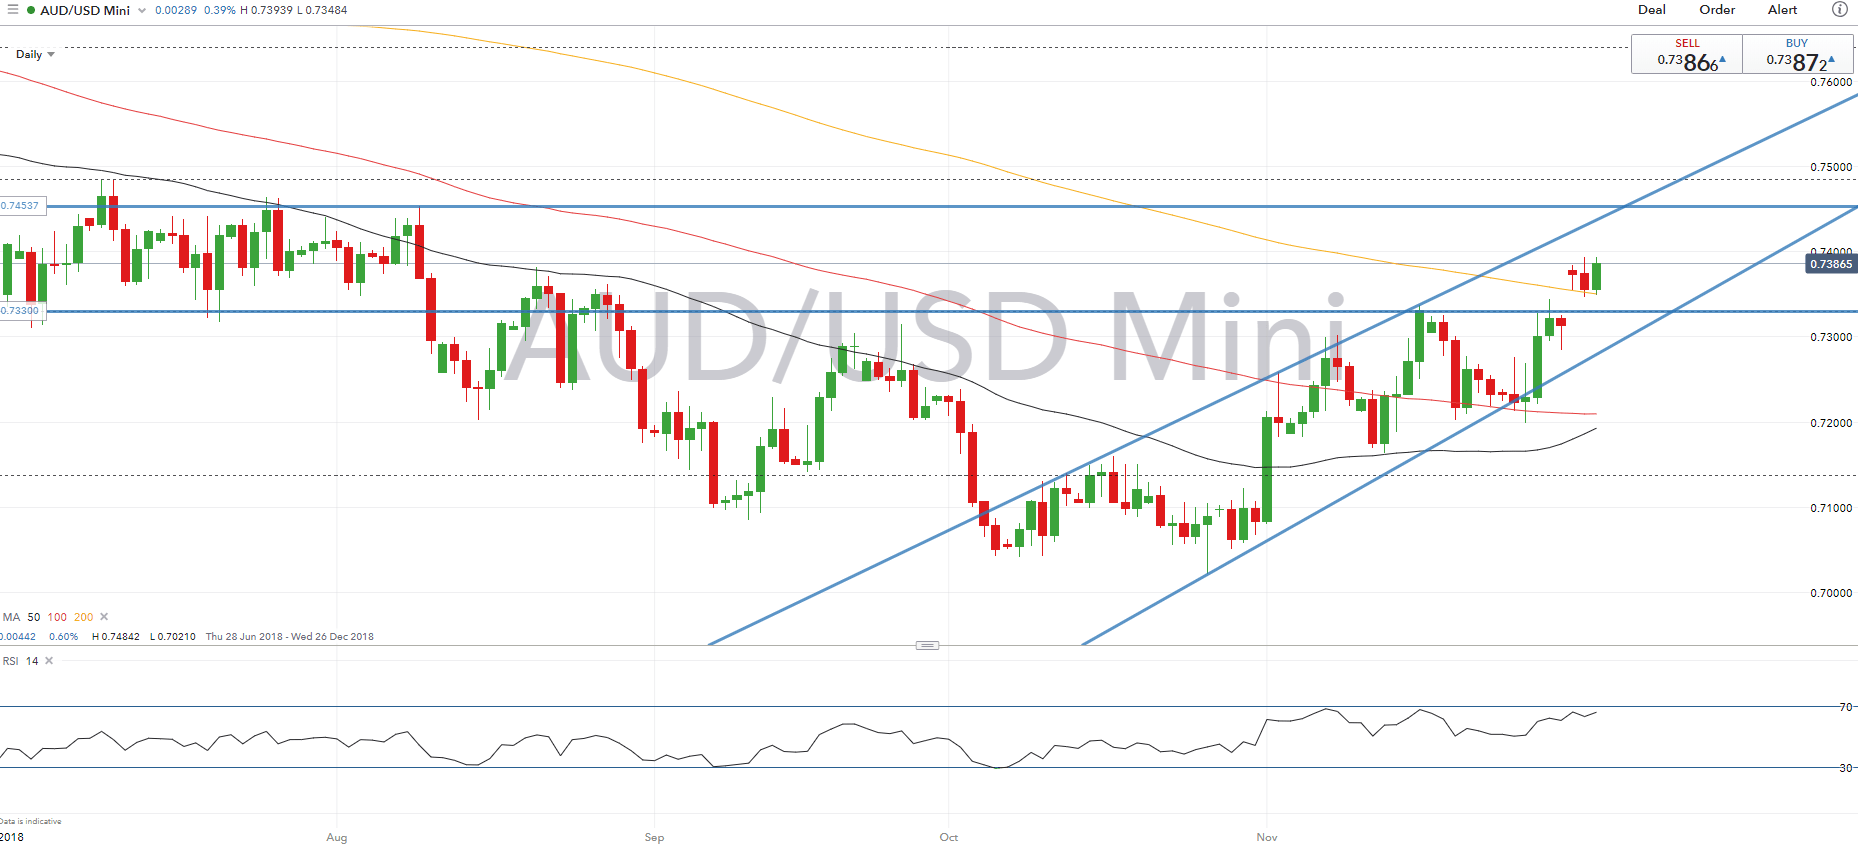
AUDUSD looks intent on testing the 0.74 handle, which has been the stumbling block so far for the pair. Further resistance situated at 0.7415, whereby a break above could open a move towards the top of the rising trendline (0.7450). Momentum indicators continue to suggest that more upside is in the pipeline for the pair.
AUDUSD PRICE CHART: Daily Time Frame (June – Dec 2018)
AUDJPY | Pullback From 84.00, However, Momentum Suggests Upside
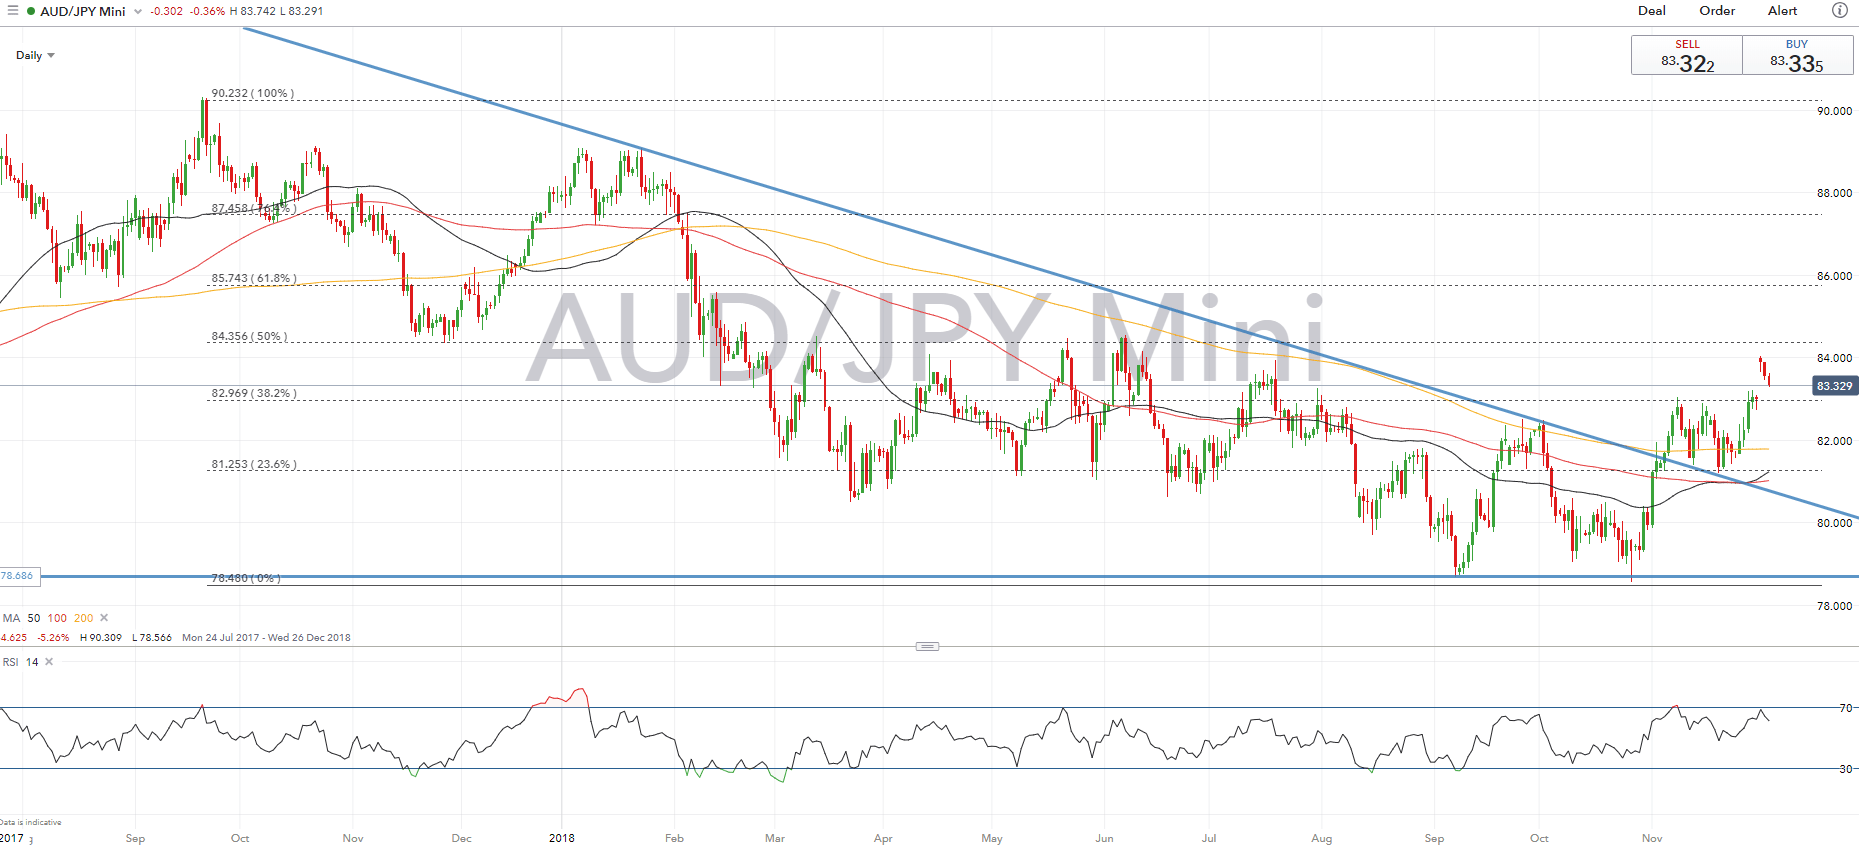
AUDJPY pulls back from the 84.00 handle, which now eyes a test of support situated at the 38.2% Fibonacci Retracement (82.96). However, despite the rejection from 84.00, risks remain tilted to the upside as momentum indicators point to a bullish bias. Key resistance at 84.30-40, in which a break could see 85.00 hit.
AUDJPY PRICE CHART: Daily Time Frame (July 2017– Dec 2018)
AUDNZD | Critical Trendline Support from Record Low Curbs Downside
Crucial support at the 1.06 handle, which also coincides with the rising trendline from the record low posted in 2015 keeps the cross afloat. Alongside this, the bullish RSI divergence on the daily time-frame increases scope for a near term bounce. However, momentum indicators remain bearish, as such, a break below trendline support could see a move of sub 1.05.
AUDNZD PRICE CHART: Daily Time Frame (Oct 2017 – Nov 2018)

G10 FX Technical Reports
--- Written by Justin McQueen, Market Analyst
To contact Justin, email him at Justin.mcqueen@ig.com
Follow Justin on Twitter @JMcQueenFX


