


What’s inside:
- Nasdaq weakness may be a sign of broader selling to set in
- The S&P 500 could be on the verge of a meaningful decline from resistance zone, but...
- A bull flag could be in the process of forming
During the past couple of weeks, equity markets have struggled to maintain higher ground, especially the ‘top-heavy’ Nasdaq 100 where a few large constituents have recently caused substantial weakness. (Here and here for more on that). Yesterday, Facebook helped stir up a bounce despite the minor fall-out in global equities following the BoJ’s unexpected inaction, but the bounce took the 100 right back into the face of prior support-turned-resistance in the 4433/50 zone.
We noted on Thursday the strategy on this end was to use that zone for establishing shorts as long as it was unable to clear it. It didn’t. During the late-day cash session the market cratered, bringing the 4382/73 support zone back into play, but only for a minute though. The Naz sliced through to 4352, but quickly recovered to close the day back above support.
The S&P 500 and Dow are acting as though they want to join the move lower, but it is still unclear. Perhaps the Nasdaq is the canary in the coal mine, time will soon tell. The break in the S&P 500 came from a failed attempted to turn back higher the past few days as it has reliably done following pullbacks since the February 11 retest low.
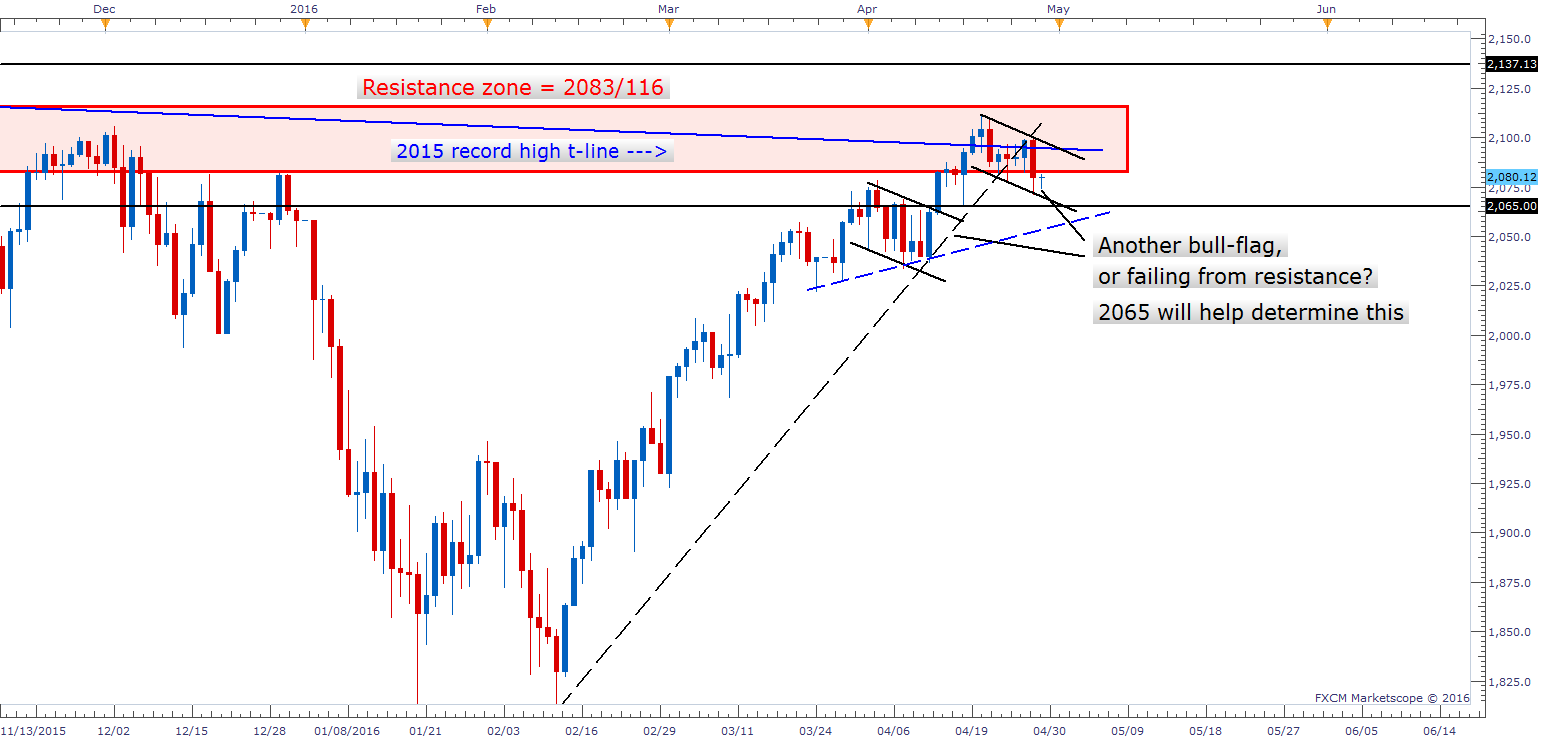
The turn lower also comes from our often cited 2083/2116 macro-zone of resistance. Whether follow-through will soon develop or not after yesterday’s break is important, as we could finally be on the cusp of a meaningful decline. Not necessarily an all-out liquidation, but a decline to get excited about – if you’re short.
If we don’t see down-side follow-through soon, though, then the possibility of further weakness will quickly diminish and the S&P could be in the process of carving out a similar formation as to the one it formed during the first half of the month – a bull flag. A break below the lower parallel and close beneath the 4/18 low (2065) would invalidate this possibility, and thus giving sellers the upper-hand. Continued horizontal work and a break above the upper parallel would put the bull-flag scenario into play, with the 2137 record high in mind as a target.
SPX500 Daily: Nov '15 - Present
Given the lack of general clarity and near direction-less nature of the market at this moment (S&P touched off on levels yesterday from the first week of the month), we continue to prefer taking quick set-ups off identifiable levels of support and resistance with in mind we will be liquidating quickly. (Like the set-up yesterday in the Nasdaq off resistance.) At some point a swing-trade worth sinking our teeth into will rear its pretty head, but for now we will be patient and take the swings the market offers.
Struggling to take good ideas from concept to execution? Check out free guide, “Traits of Successful Traders”.
---Written by Paul Robinson, Market Analyst
You can follow Paul on Twitter @PaulRobinsonFX, or email him at instructor@dailyfx.com with any questions, comments, or concerns.


