


What’s inside:
- The S&P 500 and Nasdaq 100 pull back following bearish price sequences
- Indices looking to hold support
- Uptrend and support will be given the benefit of the doubt for now
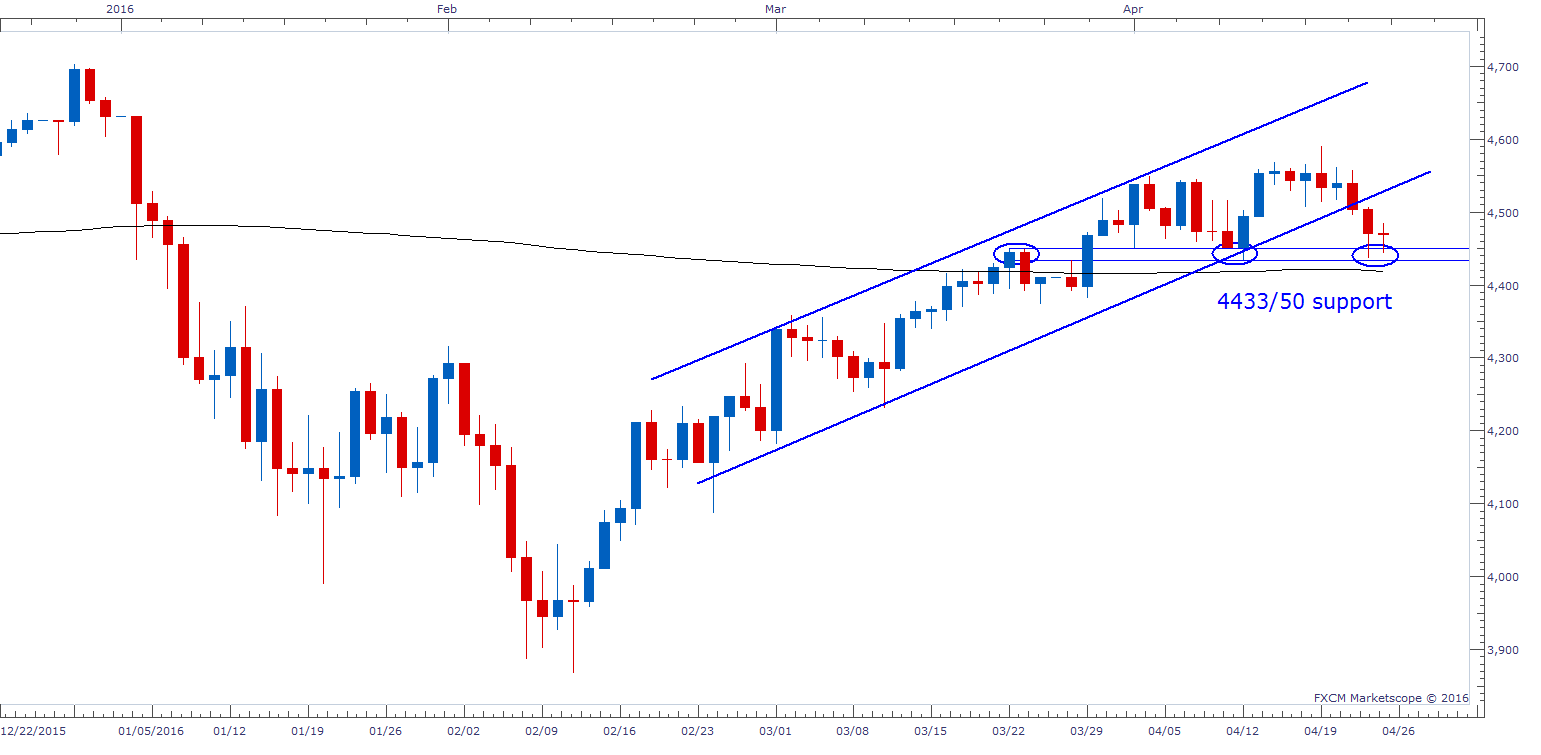
On Wednesday, we saw a nice little bearish candlestick set-up in the S&P 500 (FXCM: SPX500) on the daily, then late-day on Thursday the short-term H&S pattern in the Nasdaq 100 (FXCM: NAS100) was triggered following disappointing earnings in a couple of its biggest constituents. Friday’s reaction in the Nasdaq was strong off the cash open, with it dropping nearly 70 handles in about 90 minutes, taking the index down to the bottom of our identified support zone between 4433 and 4450.
The S&P 500 and Nasdaq 100 both probed those levels in overnight trade and have thus far rebounded a bit off their worst levels. Since peaking last week, the S&P 500 descended from the upper end of our broad resistance zone (2083/116) back to the lower end. Will old resistance (bottom of zone) act as new support within the broader zone? For now, we will give it the benefit of the doubt until it fails to do so. The Nasdaq trading at support helps strengthen the view it will hold at this time.
S&P 500 Daily

Nasdaq 100 Daily
The market has come a long way in a short period of time, making the zone of resistance in the S&P particularly interesting from a macro-standpoint. Pullbacks in the market have been short-lived since the Feb 11 retest low. Will the uptrend remain and allow the market to advance through 2116 towards the old all-time highs, or will a top, even if only for a short period of time, develop and proceed a period of weakness?
From a short-term tactical standpoint, the market is trading around support, and as long as it holds in both the S&P and Naz 100 we will look for a rebound in the near-term. However, should support give way then we would look for further selling pressure to set in.
Looking for a real-time sentiment indicator? Check out our SSI Index.
---Written by Paul Robinson, Market Analyst
You can follow Paul on Twitter @PaulRobinsonFX, or email him directly instructor@dailyfx.com.


