


- Heavy USD selling by large speculators
- Large AUD speculators add longs at fastest pace since May
- Massive shifts in JPY and CHF
For more analysis and trade setups, visit SB Trade Desk
Subscribe to Jamie Saettele's distribution list in order to receive several free reports per week
The COT Index is the difference between net speculative positioning and net commercial positioning measured. A blue colored bar indicates that the difference in positioning is the greatest it has been in 52 weeks (bullish) with speculators selling and commercials buying. A red colored bar indicates that the difference in positioning is the greatest it has been in 52 weeks (bearish) with speculators buying and commercials selling. Non-commercials tend to be on the wrong side at the turn and commercials the correct side. Use of the index is covered closely in detail in my book.
Latest CFTC Release dated December 1, 2015:
| Week (Data for Tuesdays) | |
|---|---|
| US Dollar | 4 |
| Euro | 53 |
| British Pound | 57 |
| Australian Dollar | 90 |
| Japanese Yen | 80 |
| Canadian Dollar | 12 |
| Swiss Franc | 61 |
| Mexican Peso | 24 |
| Gold | 2 |
| Silver | 18 |
| Copper | 30 |
| Crude | 4 |
Charts (all charts are continuous contract)
Non Commercials (speculators) – Red
Commercials – Blue
Small Speculators – Black
COTDiff (COT Index) – Black
US Dollar ICEUS Continuous Contract

Chart prepared by Jamie Saettele, CMT
US Dollar ICEUS Continuous Contract
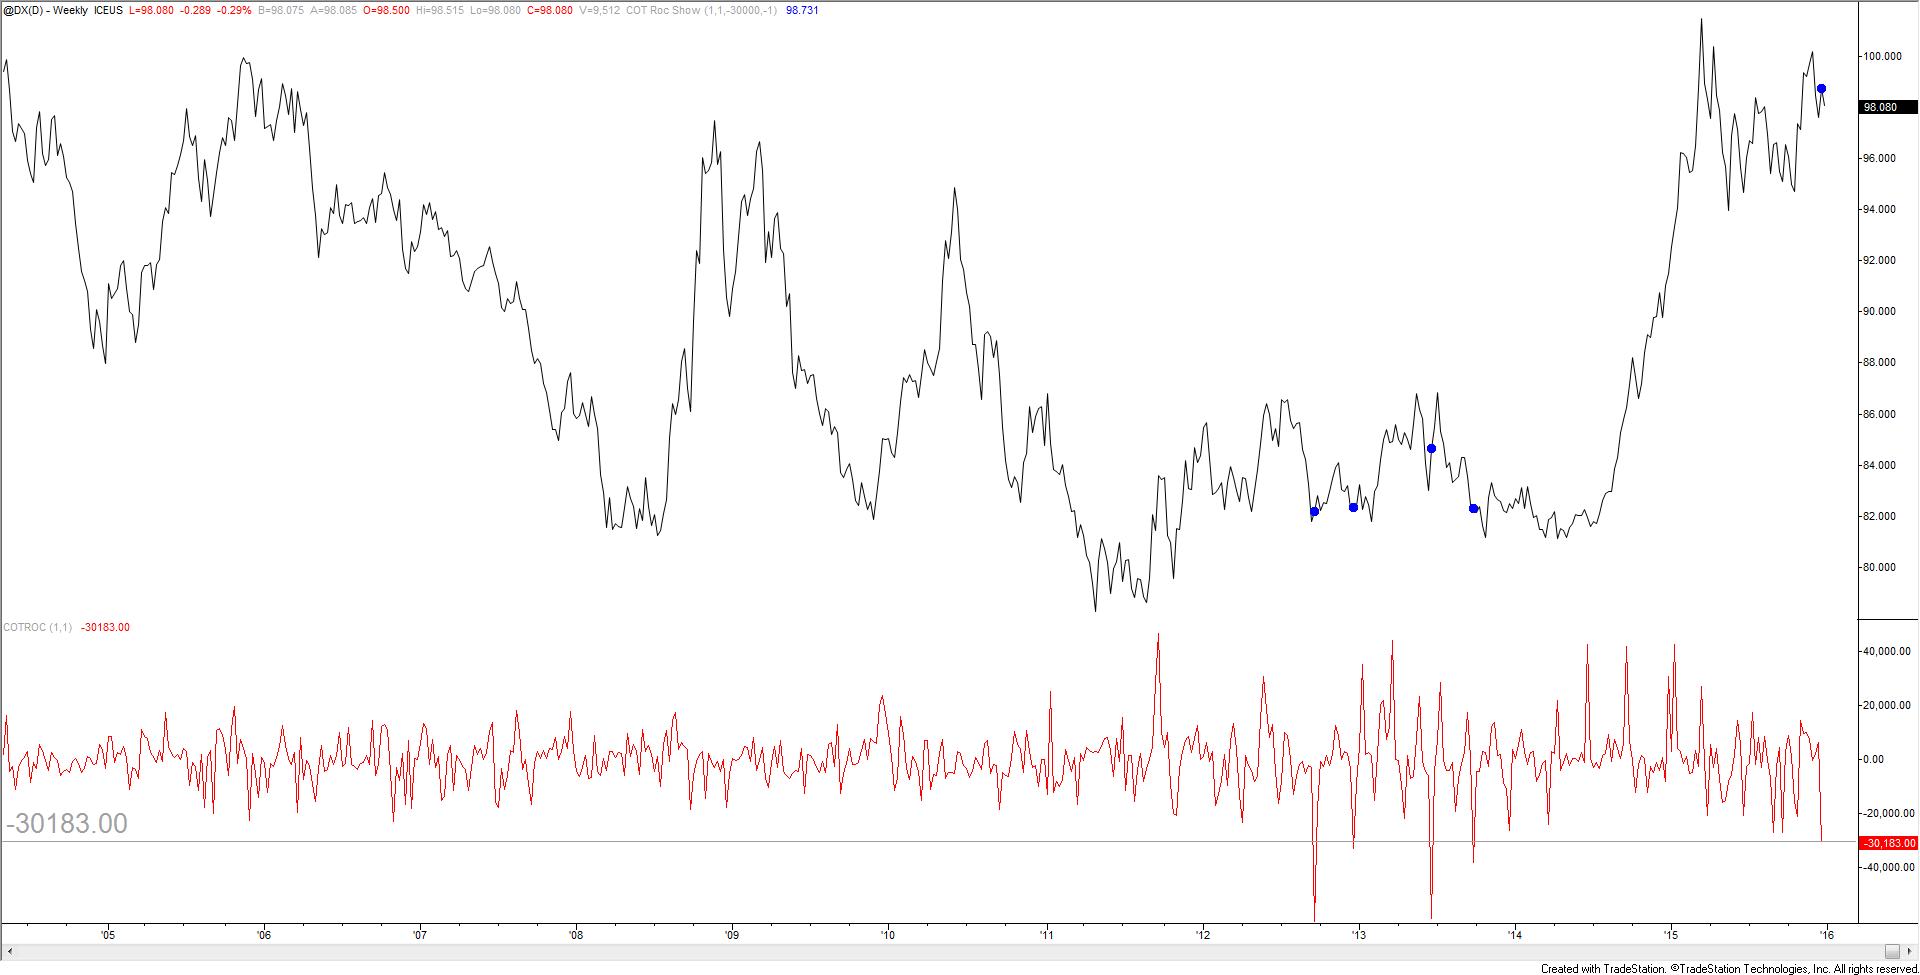
Chart prepared by Jamie Saettele, CMT
The rate of change of the COT index is plotted below price (for more on that, read Sentiment in the Forex Market) on the 2nd chart. The current positioning change is the largest since September 2013 (with speculators selling and commercials buying). The implication is that the USD is ‘sold out’ near term.
Euro CME Continuous Contract

Chart prepared by Jamie Saettele, CMT
British Pound CME Continuous Contract
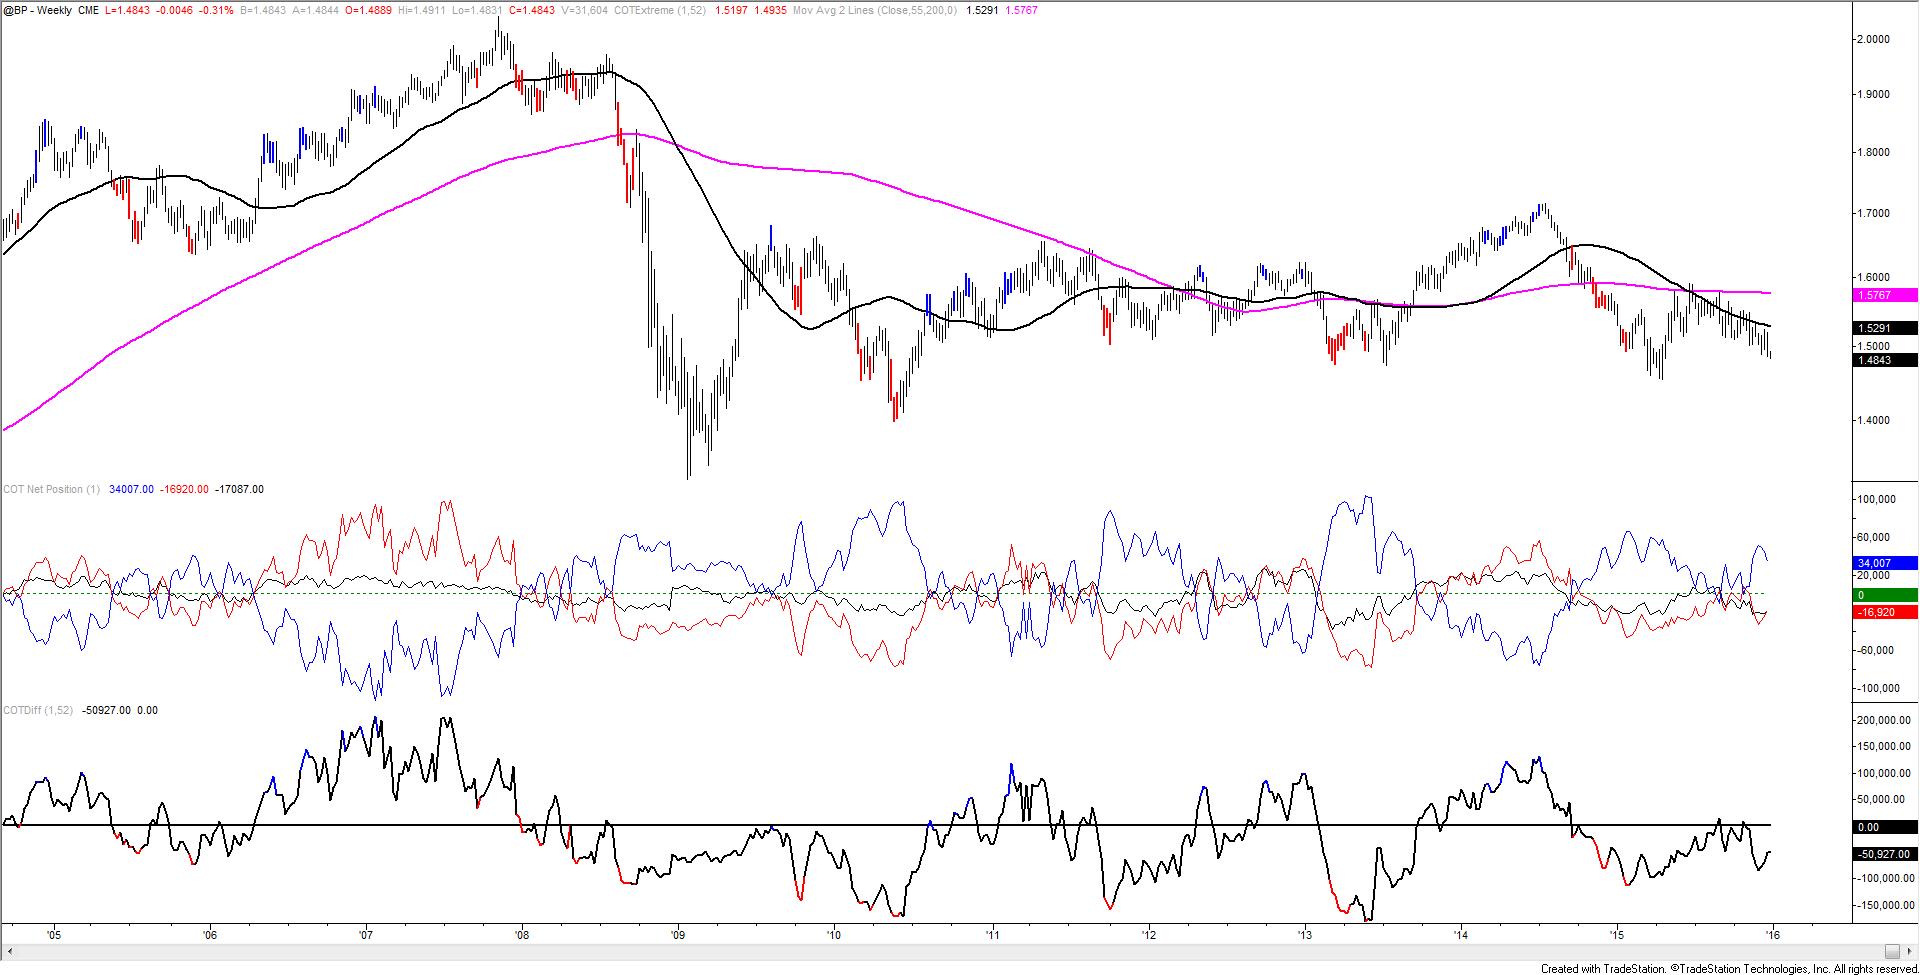
Chart prepared by Jamie Saettele, CMT
Australian DollarCME Continuous Contract
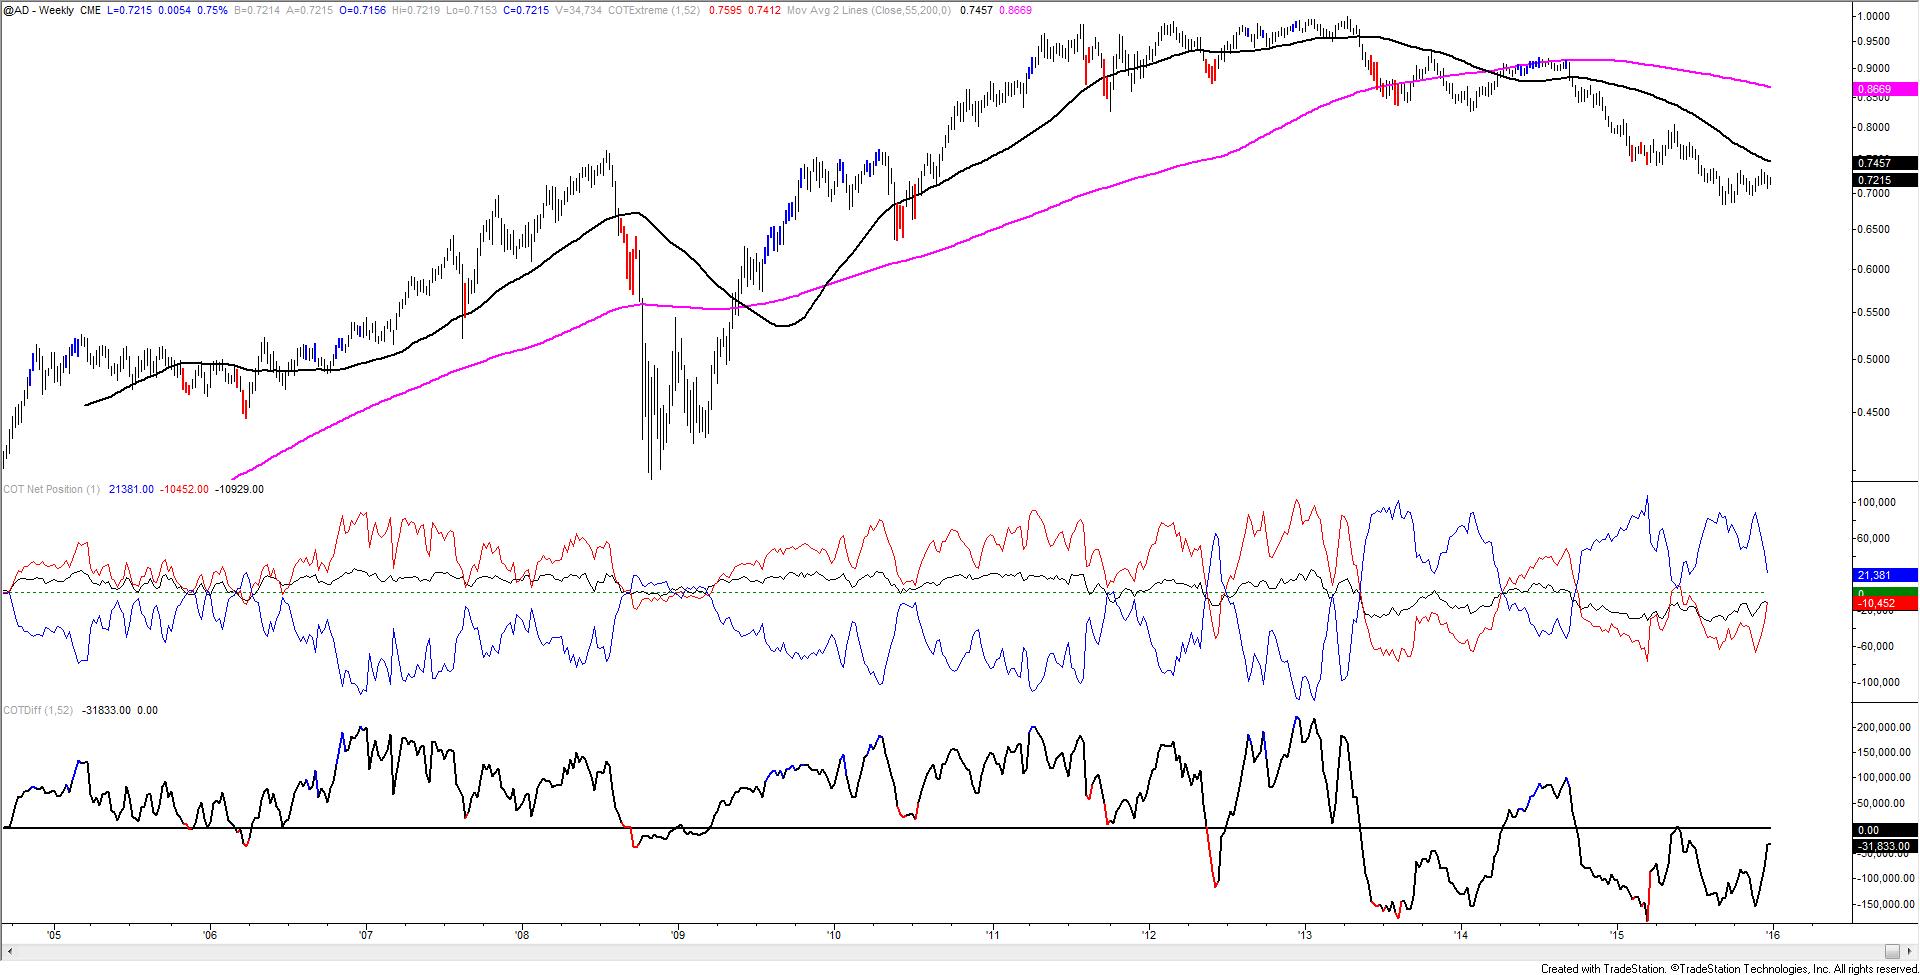
Chart prepared by Jamie Saettele, CMT
Australian DollarCME Continuous Contract
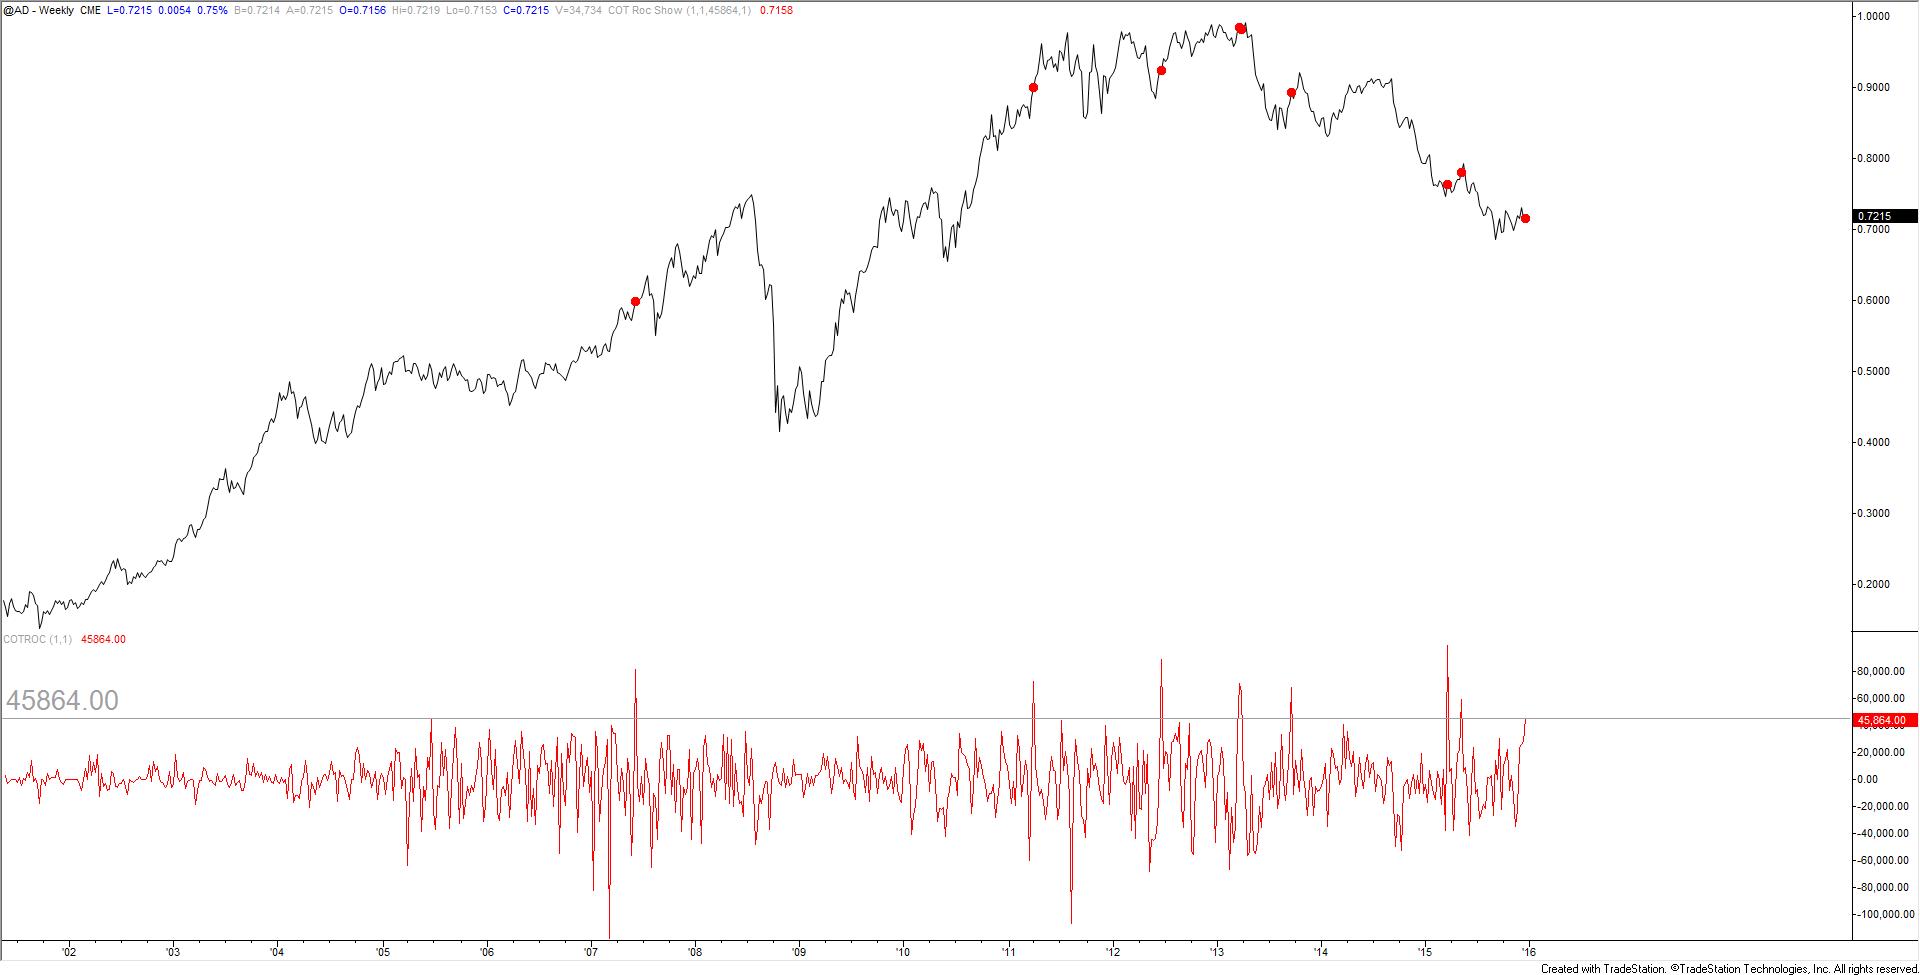
Chart prepared by Jamie Saettele, CMT
The rate of change of the COT index is plotted below price (for more on that, read Sentiment in the Forex Market) on the 2nd chart. The current positioning change is the largest since May (with speculators buying and commercials selling). The implication is that AUD is at risk of turning lower.
Japanese YenCME Continuous Contract

Chart prepared by Jamie Saettele, CMT
Japanese YenCME Continuous Contract
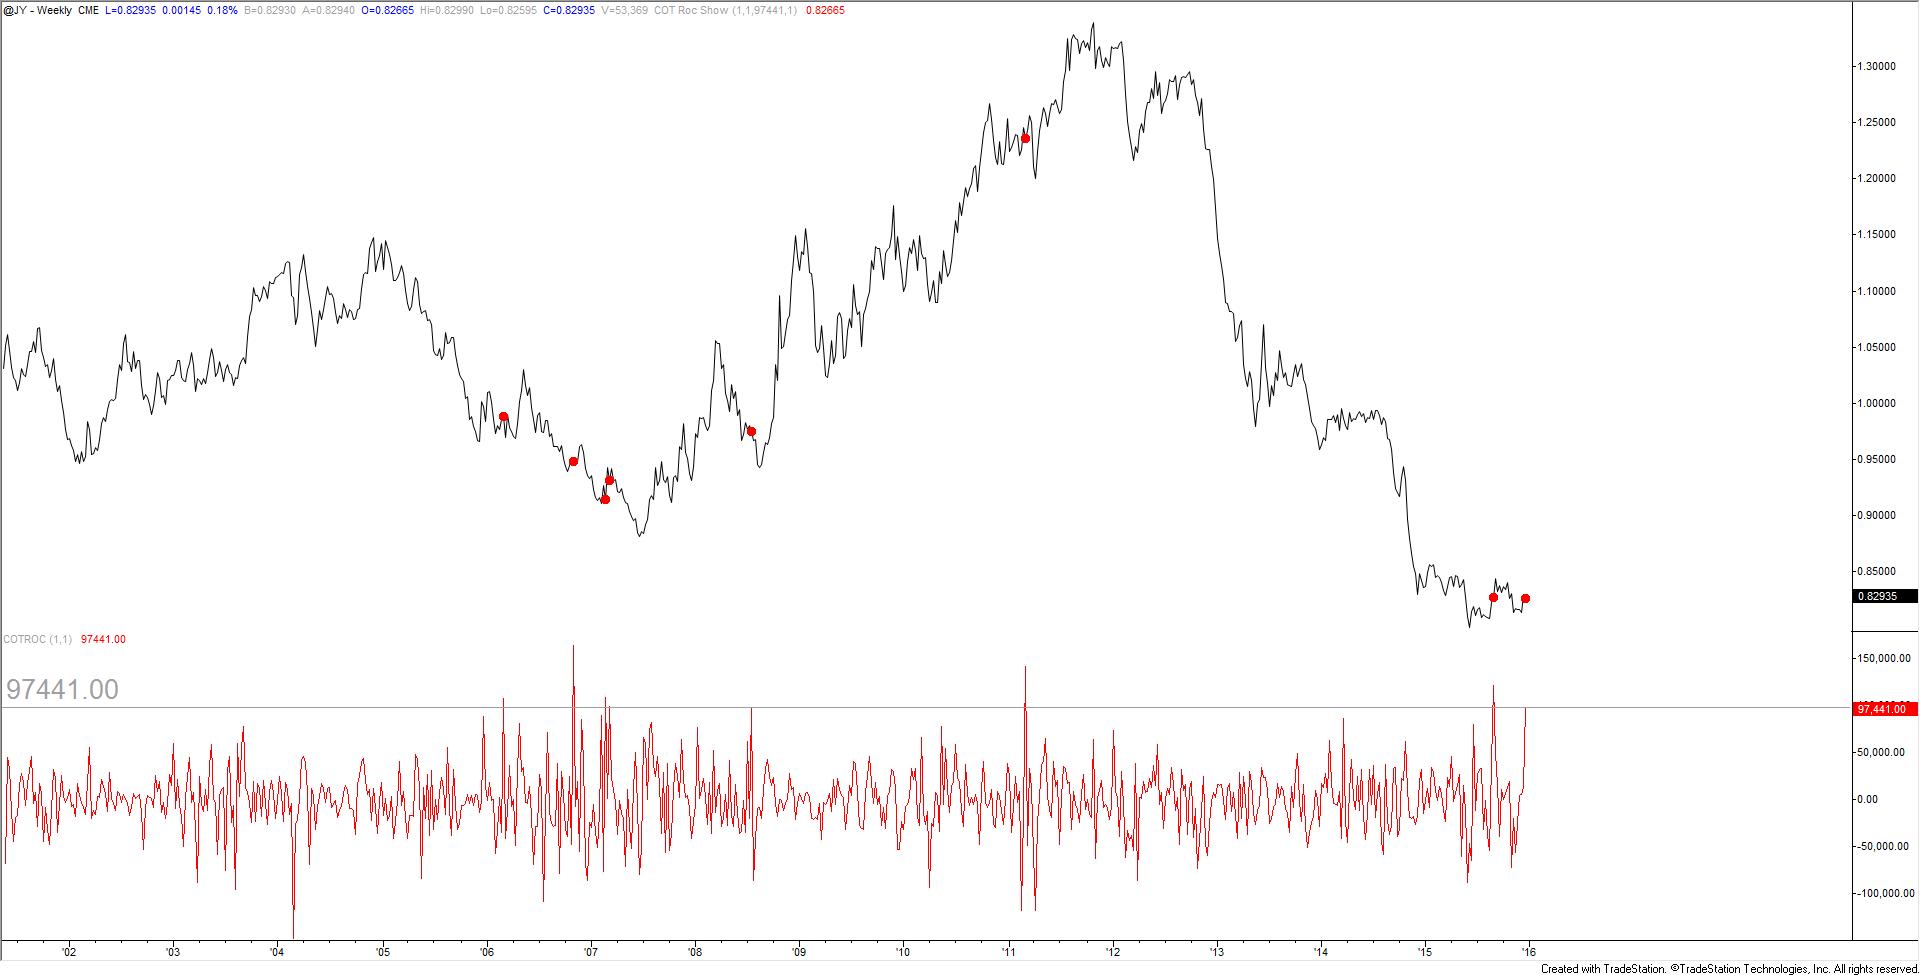
Chart prepared by Jamie Saettele, CMT
The rate of change of the COT index is plotted below price (for more on that, read Sentiment in the Forex Market) on the 2nd chart. The current positioning change is the 2nd largest of the year (with speculators buying and commercials selling) after only the ‘crash’ week of 8/28. The implication is that Yen is at risk of turning lower.
Canadian DollarCME Continuous Contract

Chart prepared by Jamie Saettele, CMT
Swiss Franc CME Continuous Contract

Chart prepared by Jamie Saettele, CMT
Swiss Franc CME Continuous Contract

Chart prepared by Jamie Saettele, CMT
The rate of change of the COT index is plotted below price (for more on that, read Sentiment in the Forex Market) on the 2nd chart. The current positioning change is the largest since September 2007 (with speculators buying and commercials selling). The implication is that CHF is at risk of turning lower.
Mexican Peso CME Continuous Contract
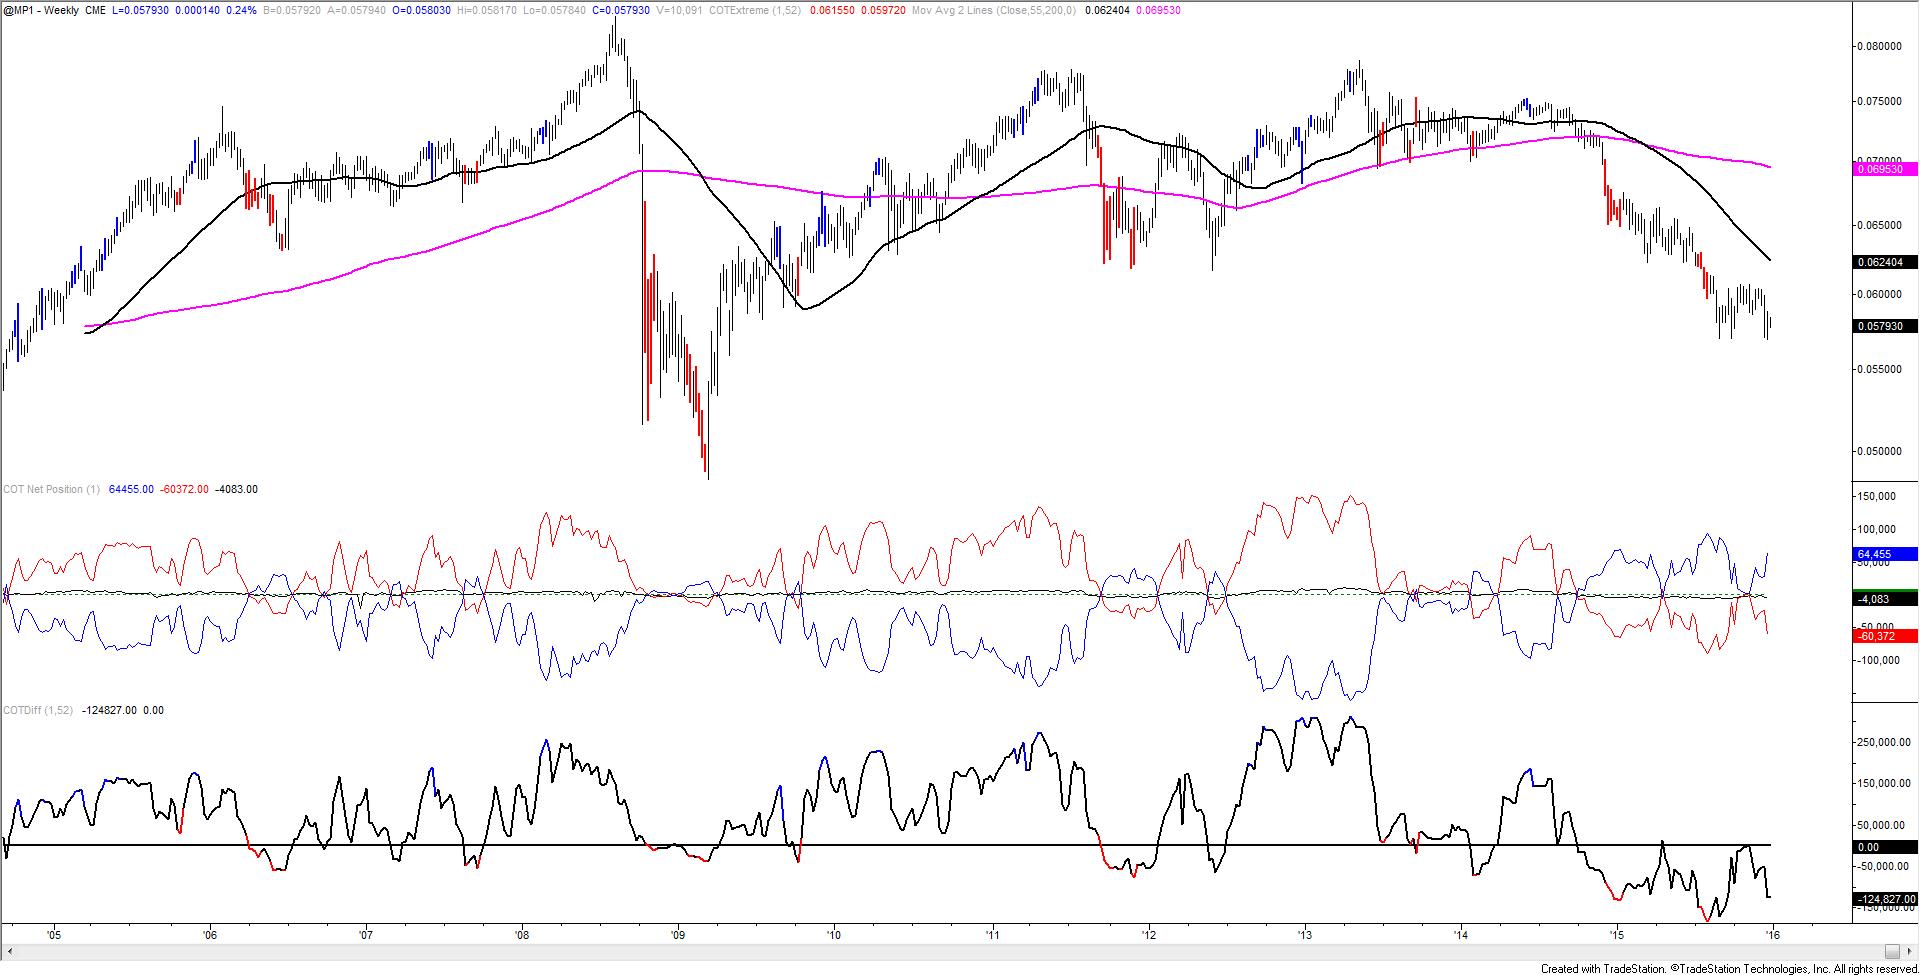
Chart prepared by Jamie Saettele, CMT
Gold COMEX Continuous Contract

Chart prepared by Jamie Saettele, CMT
Silver COMEX Continuous Contract

Chart prepared by Jamie Saettele, CMT
Copper COMEX Continuous Contract

Chart prepared by Jamie Saettele, CMT
Crude Oil NYMEX Continuous Contract
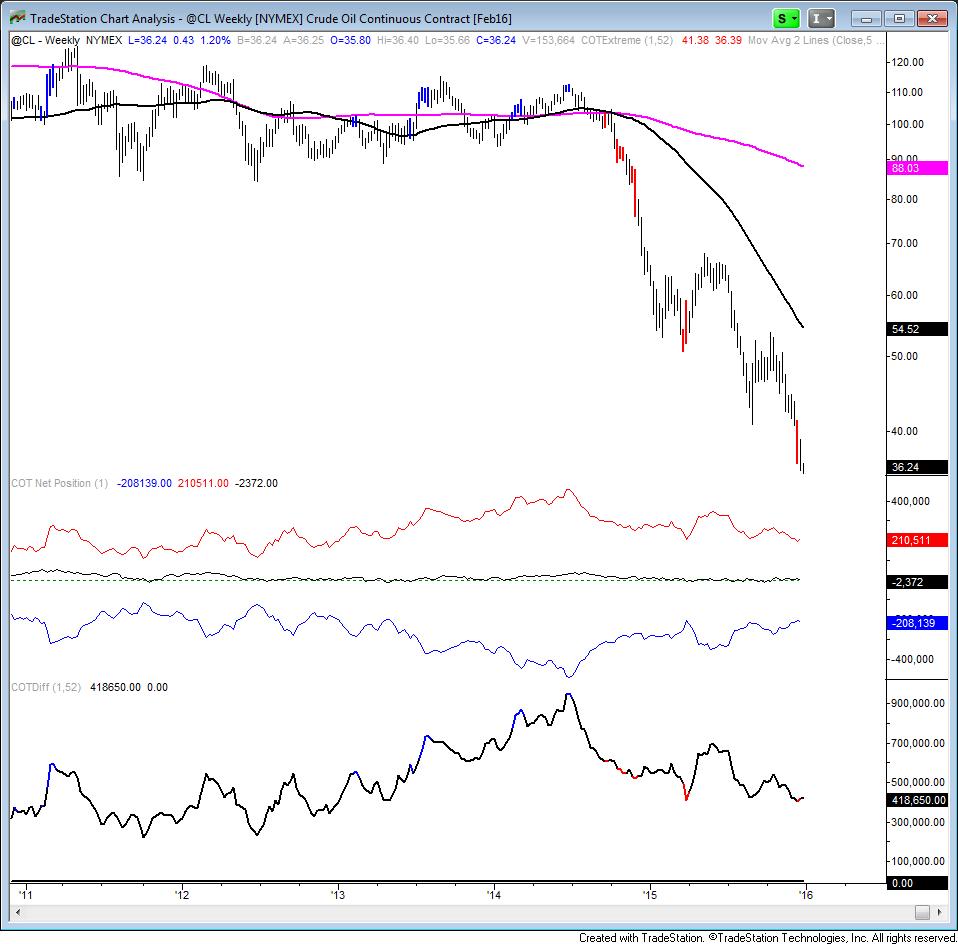
Chart prepared by Jamie Saettele, CMT
--- Written by Jamie Saettele, CMT, Senior Technical Strategist for DailyFX.com
To contact Jamie e-mail jsaettele@dailyfx.com. Follow me on Twitter for real time updates @JamieSaettele
Jamie is the author of Sentiment in the Forex Market and co-founder of SB Trade Desk.


