


AUD/USD Rate Analysis and Talking Points
- AUD/USD Slumps On Dovish Hike
- S&P 500 Bear Market Rally Stalls

AUD/USD Slumps On Dovish Hike
The Australian Dollar is underperforming this morning, despite the RBA hiking rates by 50bps for a third consecutive meeting to take the cash rate to 1.85%. The key factor behind the slump in the Aussie had been the RBA’s statement, in which the central bank stated that rate hikes are not on a pre-set path and thus adding optionality as to the size of the next rate hike. As such, money markets have repriced lower the probability of a 50bps hike at the next meeting, from 70% to 25%.
Consequently, the Australian Dollar is on course for its largest intra-day drop in a month, falling 1.5%. What’s more, softer risk sentiment has also weighed on the risk-sensitive currency as traders digest China’s tough talk in relation to Nancy Pelosi’s planned trip to Taiwan. This morning, the Global Times Editor, Hu Xijin, tweeted that Beijing has formulated a series of countermeasures, including military action. That said, in times of rising geopolitical tensions, particularly between China and the US, it is useful to understand how Twitter can provide a time advantage for traders. For more on how to use Twitter for traders, click on the link below.
How To Use Twitter For Traders
AUD/USD Posting Worst Performance In A Month
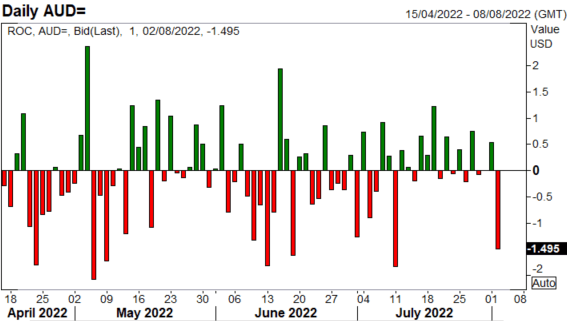
Source: Refinitiv
Elsewhere, a chart I flagged up previously regarding AUD/NZD, appears to be closing the gap.
AUD/NZD Closes the Rates Gap
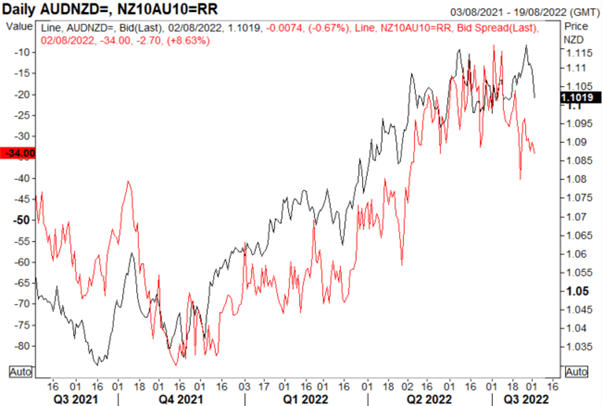
Source: Refinitiv
S&P 500: Equities are slightly softer to begin the session following the aforementioned US-China tensions over Taiwan. I remain of the view that the strong July performance was merely a bear-market rally and would looking to fade gains around resistance of 4180-4200. At the same time, the RSI recently dip above overbought territory, which suggests to me that further gains will be harder to come by.
| Change in | Longs | Shorts | OI |
| Daily | 1% | -1% | 0% |
| Weekly | 15% | -13% | -1% |
S&P 500 Chart: Daily Time Frame
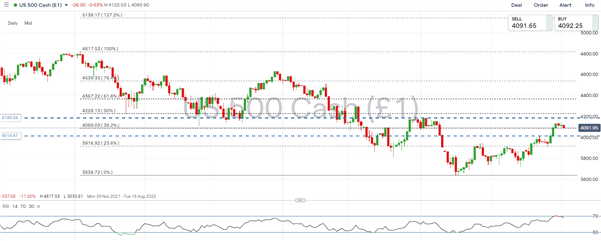
Source: IG


