RAND TALKING POINTS
- South African PPI shows no sign of letting up.
- USD/ZAR bears garner favor.
USD/ZAR FUNDAMENTAL BACKDROP
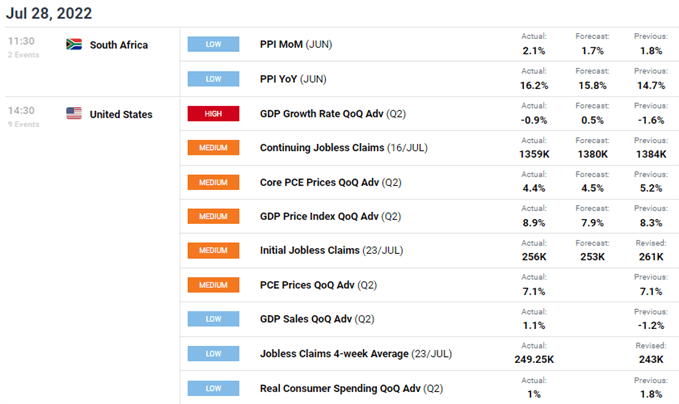
The South African rand gave back some of its gains today after the kneejerk reaction seen across global markets post-Fed. The expected 75bps interest rate hike received a dovish reaction but this does not mean I am bearish on the U.S. dollar particularly with recessionary fears looming. The U.S. GDP release missed estimates coming in at -0.9% for Q2 meaning we are in a ‘technical recession’ after the -1.6% Q1 print. One positive is the reduction in core PCE prices which could be attributed to the Fed’s aggressive tightening cycle.
From a South African perspective, PPI figures came in higher than expected adding to ZAR strength in early trading while the U.S. GDP miss flagged a slowing U.S. economy thus adding to downside pressure on the greenback. Because the rand is so highly correlated to China, the U.S. decline did not spark risk aversion from the ZAR.
USD/ZAR ECONOMIC CALENDAR

Source: DailyFX Economic Calendar


TECHNICAL ANALYSIS
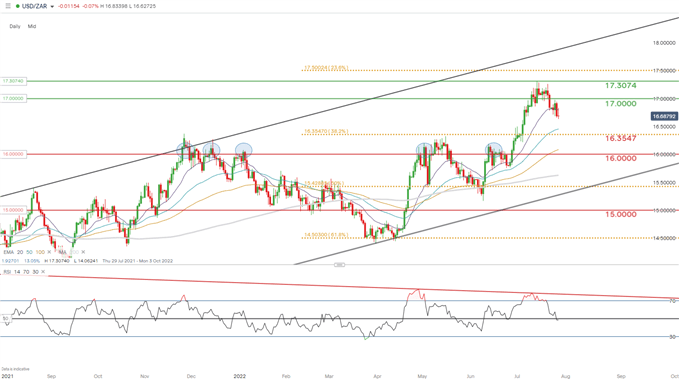
USD/ZAR DAILY CHART

Chart prepared by Warren Venketas, IG
Daily USD/ZAR price action shows bears taking charge pushing towards the 16.5000/50-day EMA (blue) support zone. The Relative Strength Index (RSI) has also pierced below the midpoint 50 level indicative of increasing bearish momentum.
Resistance levels:
- 17.0000
- 20-day EMA (purple)
Support levels:
Trade Smarter - Sign up for the DailyFX Newsletter
Receive timely and compelling market commentary from the DailyFX team
Contact and follow Warren on Twitter: @WVenketas


